
Figure 2.
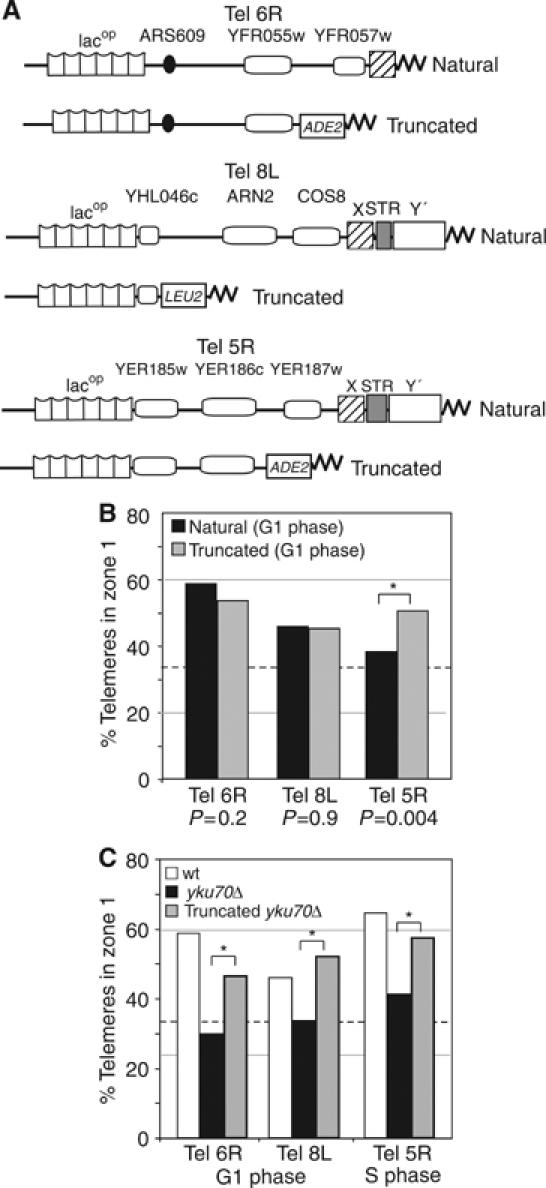
Localization of truncated telomeres. (A) Scheme of natural telomeres with lacop array and truncated telomeres after STEs are replaced by a gene marker (ADE2 for Tel6R and 5R, LEU2 for Tel8L). Bar graph as in Figure 1D, presents the percentage of foci in zone 1 for natural or truncated telomeres 6R, 8L and 5R (GA-1917, GA-2256 and YG-138) in G1 cells. Here asterisks indicate significantly different distributions (P-values reflect a proportional comparison between natural and truncated telomeres). (B) Telomere position was monitored for natural or truncated telomeres in the indicated strain background. (C) Bar graph as in (B) with zone 1 values for natural Tel6R, 8L and 5R in wt (open boxes) or ku70Δ trains (black boxes, GA-1489, GA-1916, GA-195) or for truncated forms in ku70Δ (grey boxes, GA-1948, GA-2804, GA-149). For P-values see Supplementary Table 1.