
Figure 4.
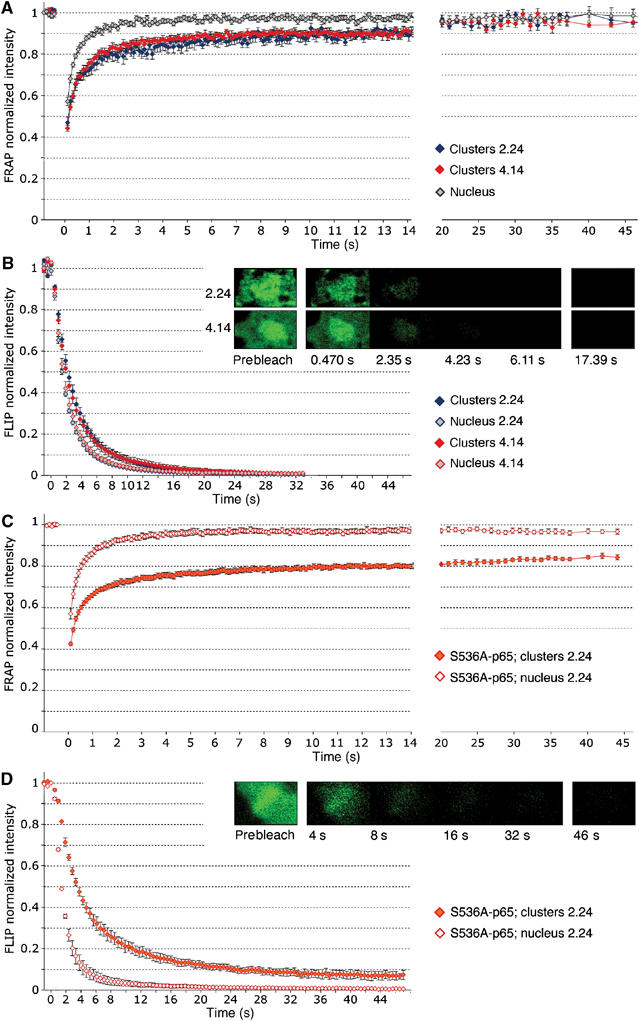
Dynamics of NF-κB exchange on trascriptionally active chromatin. FRAP (A) and FLIP (B) curves on clone 2.24 (HIV-LTR) and 4.14 (synthetic gene). Curves are averaged from 10 clusters per type, and 20 nondescript areas in the nuclei (the two types of clones have been merged as there is no statistical difference between them). Bars represent standard error. The differences between the curves representing the two types of clusters are statistically nonsignificant, whereas the difference between any of the clusters and the rest of the nucleus is highly significant (P<0.001). In (B), the image series show the fluorescence loss over time at the cluster from one cell each of clones 2.24 and 4.14. FLIP curves are averaged from 10 cells each; bars represent standard error. The differences between the curves representing the two types of clusters are statistically nonsignificant, whereas the difference between any of the clusters and the rest of the nucleus is highly significant (P<0.002). (C) FRAP and (D) FLIP for S536A p65-GFP on the HIV-LTR cluster (clone 2.24). Curves are averaged from eight clusters and 10 nondescript areas in the nuclei; bars represent standard error.