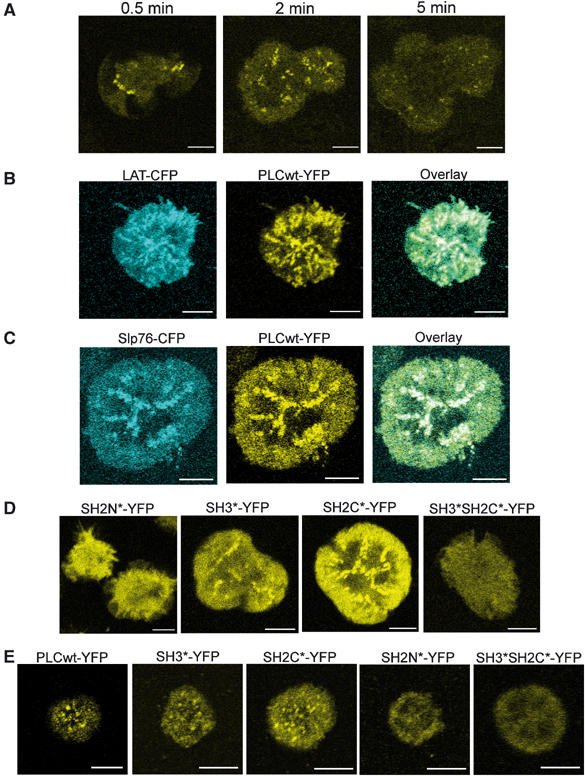
Figure 1.

Visualization of PLCγ1 recruitment to signaling clusters in Jurkat E6 cells. (A) Jurkat E6 cells expressing PLCwt-YFP were seeded on stimulatory coverslips. Images obtained 0.5, 2 and 5 min into the spreading process are shown. The size bar corresponds to 5 μm. (B) Jurkat E6 cells expressing LAT-CFP and PLCwt-YFP were seeded on stimulatory coverslips. Images obtained 1.5 min into the spreading process are shown. The size bar corresponds to 5 μm. (C) Same as (B) for cells expressing Slp76-CFP and PLCwt-YFP. (D) Jurkat E6 cells expressing mutant PLCγ1-YFP conjugates as indicated were seeded on stimulatory coverslips. Images obtained 1–1.5 min into the spreading process are shown. The size bar corresponds to 5 μm. (E) Murine primary CD4+ T cells expressing PLCγ1-YFP conjugates as indicated were seeded on stimulatory coverslips and fixed 5 min into the spreading process. The size bar corresponds to 5 μm.
