
Figure 2.
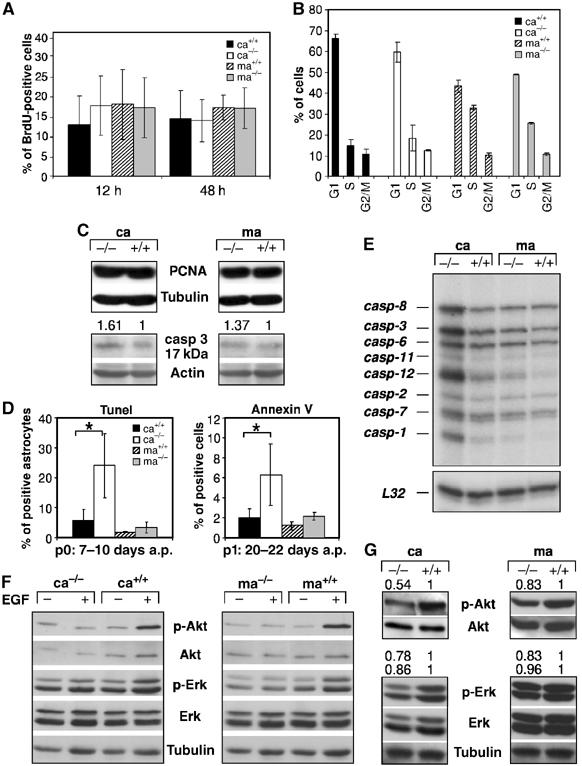
Increased apoptosis and reduced Akt activation in mutant cortical astrocytes. (A) Quantification of the number of BrdU-positive astrocytes (18 days a.p.) labeled for 12 and 24 h. Data represent the mean±s.e.m. of the number of positive cells counted in randomly chosen fields of three independent samples. (B) FACS analysis on primary astrocytes (18 days a.p.) pulsed for 12 h with BrdU showing the number of cells in the various stages of the cell cycle. Data represent the mean±s.e.m. of three independent samples. (C) Western blot analysis showing expression of the proliferating cell nuclear antigen (PCNA) and the active 17 kDa isoform of caspase-3 (casp-3). Actin served as loading control and the numbers indicate protein expression levels relative to controls normalized to actin. (D) Tunel and AnnexinV staining performed at the indicated time point after initial preparation (a.p.). For AnnexinV, data represent the mean±s.e.m. of the number of positive cells measured by FACS in three independent experiments. For Tunel staining, the data represent the percentages of Tunel and GFAP double-positive astrocytes after counting 700–1400 GFAP-positive astrocytes from randomly chosen fields of four independent experiments. (E) Expression of caspases in primary 80% confluent astrocytes of the indicated genotypes by RNase protection analysis. L32 mRNA served as loading control. (F) Akt and Erk 1/2 activation in cortical and midbrain astrocytes starved (−) for 18 h in medium containing 0.1% serum and stimulated with 20 ng/ml EGF (+) for 5 min. (G) Western blot analysis showing Akt and Erk 1/2 phosphorylation in 80% confluent astrocyte cultures of the indicated genotypes. Tubulin and total Akt and Erk served as loading controls. The numbers indicate protein expression levels relative to controls normalized to total Akt or Erk. Ca: cortical astrocytes; ma: midbrain astrocytes. *P<0.05.