
Figure 5.
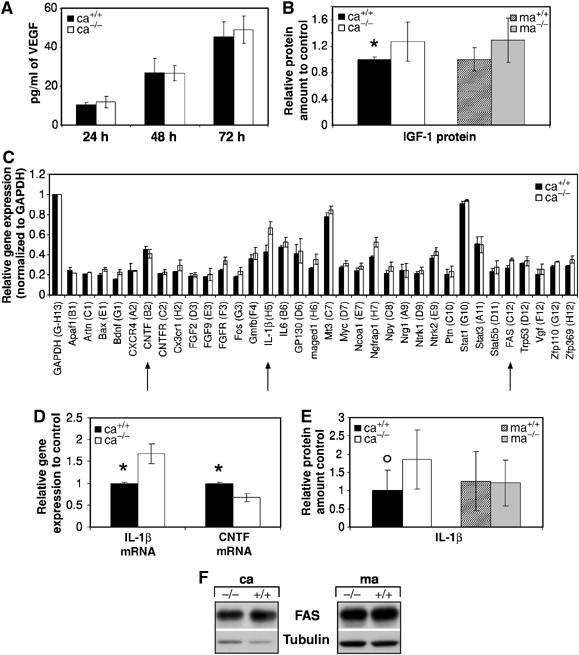
Mechanisms of neuronal loss in co-cultures with EGFR−/− cortical astrocytes. ELISA showing VEGF (A) and IGF-1 (B) protein levels in the supernatants of astrocyte cultures (18–20 days a.p.) of the indicated genotypes. The data represent the mean±s.e.m. of six independent samples. (C) Relative expression of each gene in wild-type and EGFR−/− cortical astrocytes after normalization to the house-keeping gene GAPDH. Normalization to Ppia gave similar results (data not shown). Only genes with signals above background are displayed. The data represent the mean±s.e.m. of the normalized values for each gene of two array experiments with two independent RNA batches. (D) Real-time quantitative RT–PCR analysis showing expression of CNTF and IL-1β. Similar results were obtained in a second independent RNA batch. Data represent the mean±s.e.m. of the relative expression levels to controls (ca+/+) after normalization with the house-keeping gene PBGD measured in two independent experiments. (E) IL-1β protein levels measured by ELISA in the supernatants of astrocyte cultures (18–20 days a.p.) of the indicated genotypes. The data represent the mean±s.e.m. of four independent samples. (F) Western blot analysis showing Fas expression in astrocytes of the indicated genotypes. Tubulin served as loading control. *P<0.05, °P=0.05.