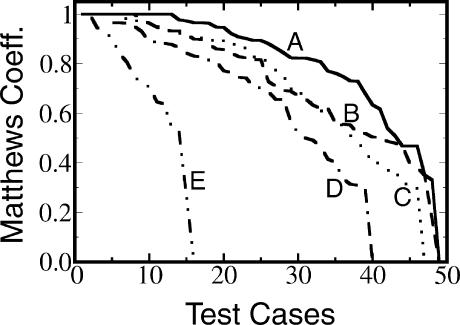
FIGURE 3.
Prediction accuracy for the test set of 49 RFAM alignments. A indicates method presented in this article (KNetFold); B, nonlinear RNAfold consensus probability matrix (NL-RNAfold); C, PFOLD Web server; D, RNAalifold; E, intermediate result (corresponds to output of classifier M in Figure 2 ▶ and “Intermediate” in Table 1 ▶). The data shown correspond to the results of RFAM alignments in the test set. For each method, the highest prediction accuracies are plotted leftmost. If the original RFAM alignment contained >40 sequences, a “thinned” alignment consisting of 40 representative sequences was used instead.

