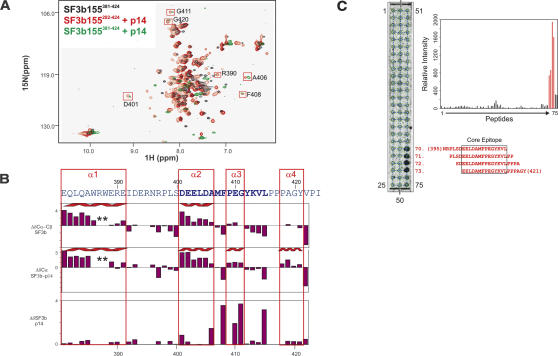
FIGURE 2.
Secondary structure and p14 binding site of SF3b155. (A) 1H,15N correlation spectrum of 15N-labeled SF3b282–424 (black) and in the presence of unlabeled p14 (red). 1H,15N correlation spectrum of SF3b381–424 after addition of p14 (green). Addition of p14 to SF3b282–424 or SF3b381–424 affects the same set of residues in both spectra. Residues with large chemical-shift perturbations belong to the minimal binding epitope for the p14 interaction and are boxed in red. (B) 13C secondary chemical shifts of free SF3b155282–424 and when bound to p14 (row 1 and 2), and chemical-shift perturbation of SF3b155282–424 upon addition of p14. Secondary structure elements are indicated on top. (C) Peptide scan analysis of the SF3b155–p14 interaction. (Left) Autoradiogram obtained by incubating the cellulose-bound peptide array with [35S]methionine-labeled p14. Peptide numbers for the terminal spots are indicated. Sequences for peptides 70–73, which constitute the central binding epitope of SF3b155 for p14, are indicated in red (starting and ending residue numbers in parentheses). (Right) Bar graph of the quantified relative affinities of the SF3b155 peptides 1–75 toward p14 (represented by the radioactivity at each spot). The response of the peptides 70–73, comprising the central binding epitope, is shown in red.

