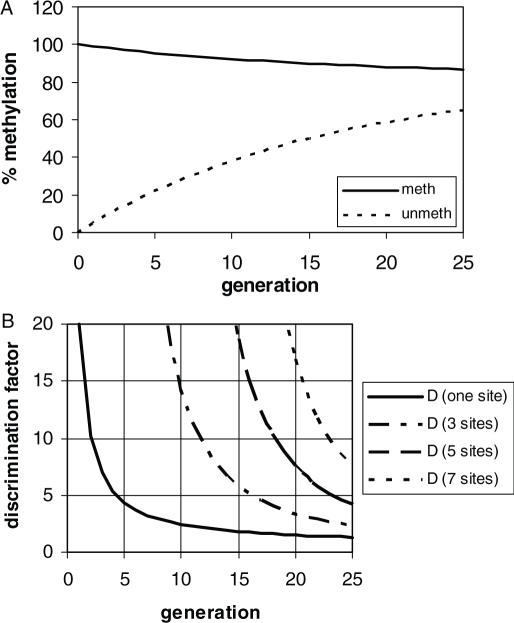
Figure 5.
Simulation of the average methylation level of an unmethylated and hemimethylated population of DNA molecules during several generations. For the simulation an average level of maintenance methylation of 95% and a 20-fold preference for hemimethylated DNA was used. In (A) the average methylation levels of the hemimethylated and unmethylated populations at one CG site are shown, in (B) the discrimination factor (defined as the ratio of the average methylation levels of both populations) is shown if one, three, five or seven CG sites are concerned.

