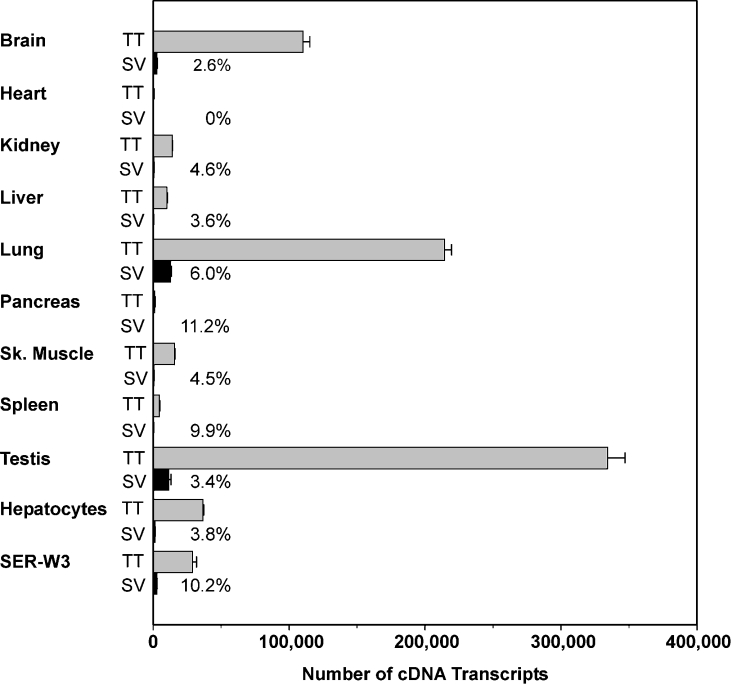
Figure 3. Quantification of rat Abca5 and rat Abca5 V20+16 cDNA transcripts in nine selected rat organs, freshly isolated rat hepatocytes and a Sertoli cell line (SER-W3).
The total number of cDNA transcripts was determined in 40 ng of reverse transcribed cDNA. The relative amount of splice variant transcript (SV) was calculated with respect to the amount of total rAbca5 cDNA transcripts (TT) and is shown as numbers (%) in the diagram. Error bars indicate the S.D. for experiments performed in triplicate. SV, splice variant.

