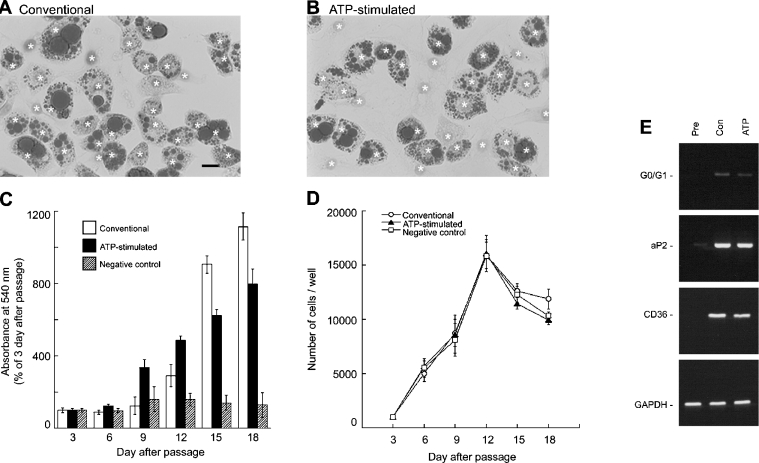
Figure 6. Characterization of adipocytes differentiated by ATP-stimulated hormone-induced protocol.
(A and B) Triacylglycerol staining of 3T3-L1 adipocytes by Oil Red O. Day 15 for fat cells converted by the conventional (A) or ATP-stimulated (B) protocol. *, haematoxylin-positive nucleus. Scale bar, 20 μm. (C and D) Approx. 1000 cells were subcultured in 24 well plates on day 0 to determine triacylglycerol content by Oil Red O assay (C) and to count the number of cells (D). Triacylglycerol-assay was performed as described in the Experimental section and absorbance measured at 540 nm on day 3 was used as a control value. Open columns and open circles indicate the cells treated with the conventional differentiation protocol. Closed columns and closed triangles indicate those treated with the ATP-stimulated protocol. The hatched columns and open squares indicate the cells treated with the negative control protocol. For counting cell number, cells were suspended in PBS after trypsinization and observed with a haemocytometer. Each value represents the mean±S.E.M. for six separate experiments. Statistical significance compared with day 3 was determined by Student's t-test. (E) RT-PCR analysis of the expression of P2Y receptor subtypes genes in 3T3-L1 cells. Pre, preadipocytes; Con, adipocytes differentiated by the conventional protocol; ATP, adipocytes converted by the ATP-stimulated protocol. mRNAs encoding G0/G1, aP2, and CD36 were detected by RT-PCR analysis using GAPDH as a control. The fragments of amplified DNA were found to be identical to the sequences reported previously.

