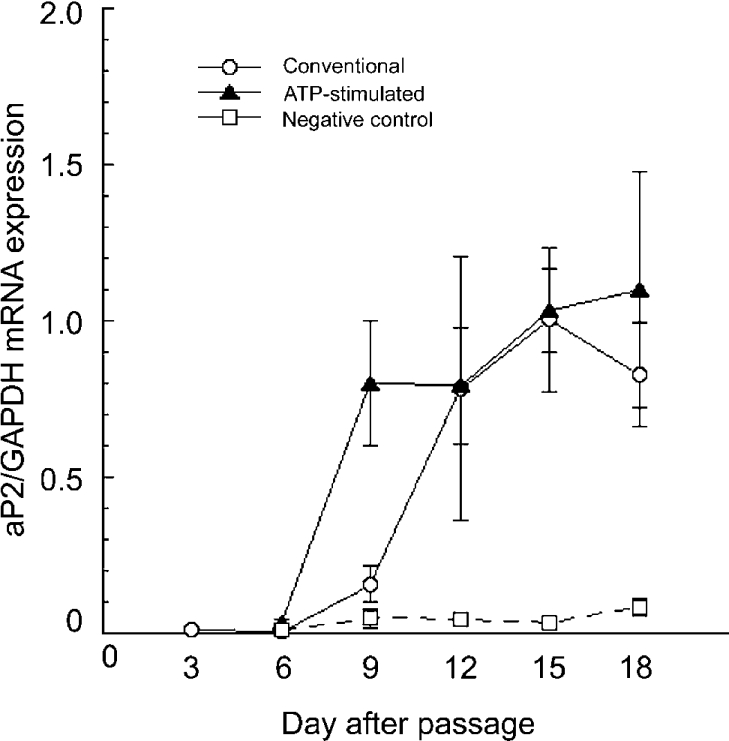
Figure 7. Effect of ATP on aP2 gene expression in adipocyte differentiation.
Quantification of the expression of the aP2 gene during the differentiation procedure was determined with real-time quantitative RT-PCR using GAPDH as a control. The day when cells were subcultured in a new plate was defined as day 0. Open circles indicate the cells treated with the conventional protocol, closed triangles indicate those treated with the ATP-stimulated protocol and open squares indicate the cells treated with the negative control protocol. Each value represents the mean±S.E.M. for three separate experiments with duplicate measurement. Statistical significance compared with day 3 was determined by Student's t-test.

