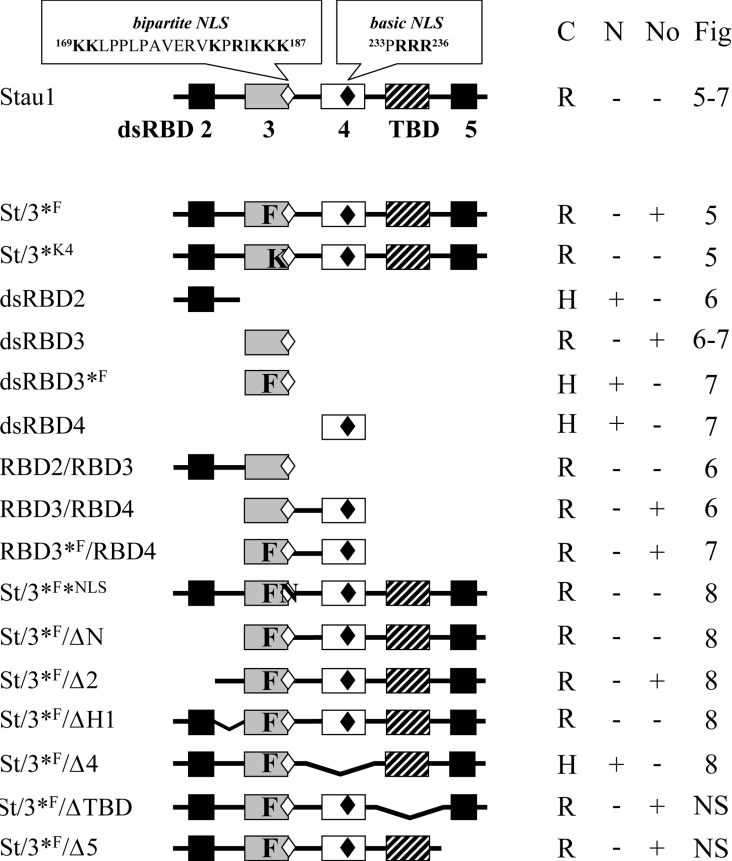
Figure 1. Schematic representation of Stau1 and Stau1 mutants.
Left: Stau1 and Stau1 mutants used in the present study are depicted. Grey and white boxes represent the major (dsRBD3) and minor (dsRBD4) RNA-binding domains respectively; black boxes represent regions with RNA-binding consensus sequence but lacking RNA-binding activity in vitro. The hatched box indicates the position of the region similar to the MAP1B microtubule-binding domain. The positions of the bipartite (◇) and basic (◆) NLSs are indicated. F, mutation F135A in dsRBD3; K, mutations H131A, K133A, K153A and K154A in dsRBD3; N, mutations K181N, R183S and K185N in the bipartite NLS. Right: summary of the principal results. C, cytoplasmic distribution; N, nuclear distribution; No, nucleolar distribution; Fig, Figure where data can be seen; R, reticular distribution of Stau1 in the cytoplasm; H, homogeneous random distribution of Stau1 in the cytoplasm; +, presence of at least a fraction of Stau1 in the specified organelle; −, absence of Stau1 in the specified organelle; NS, not shown.

