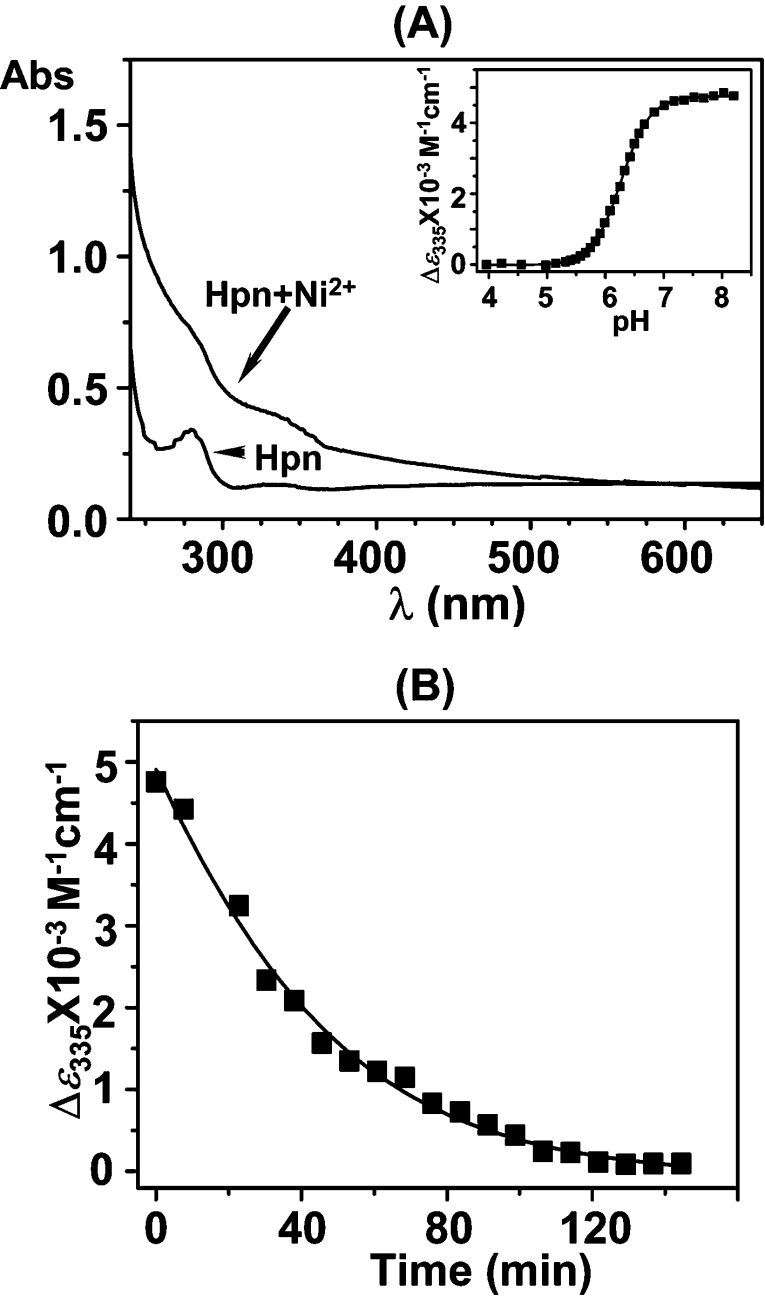
Figure 4. Binding of Ni2+ to recombinant Hpn as determined by UV/vis absorption spectra.
(A) UV/vis absorption spectra of Hpn (50 μM) in 20 mM Hepes, pH 7.4, and 100 mM NaCl (lower trace) and after addition of 5 molar equivalents of Ni2+ (as NiSO4) (upper trace). Inset, pH titration of Ni2+-saturated Hpn, monitoring the putative Ni2+–protein LMCT at 335 nm. (B) Kinetics of Ni2+ release from Hpn in the presence of 120 molar equivalents of EDTA at pH 6.8 and 298 K, as indicated by the absorption at 335 nm.

