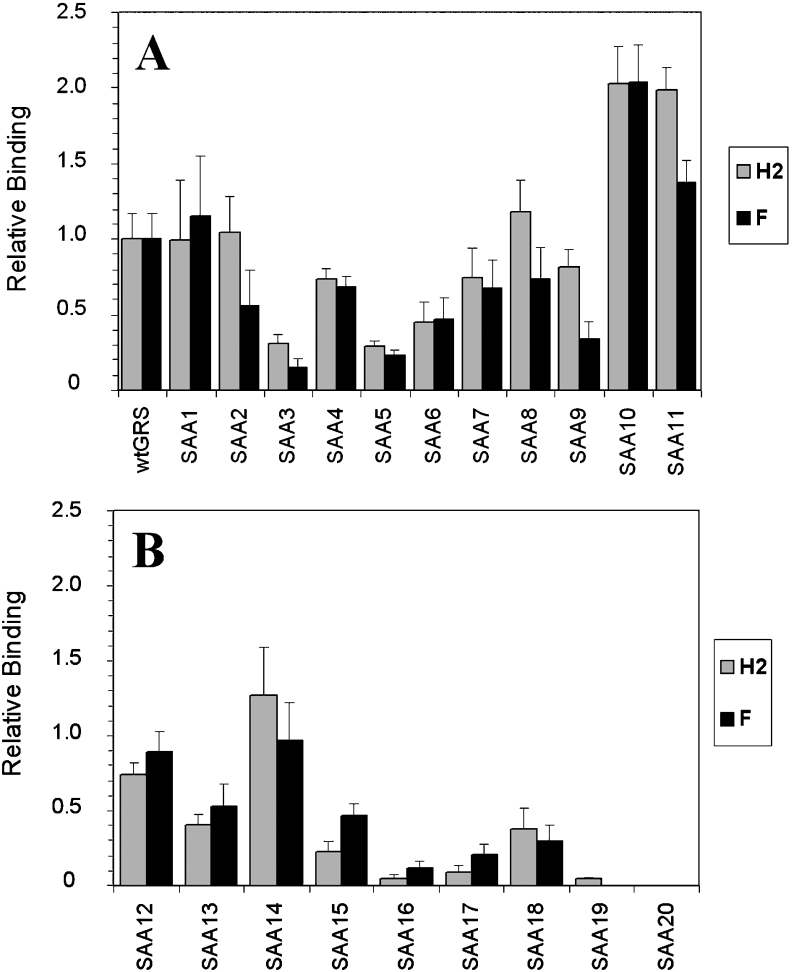
Figure 4. hnRNP F and H2 show similar binding to mutations in the GRS.
(A, B) Relative binding of wild-type and mutant GRS oligoribonucleotides whose sequences are shown in Table 1 to hnRNP F (F) and hnRNP H2 (H2) proteins. EMSAs were performed with 250 pM of each probe and 330 nM His–hnRNP F or 210 nM GST–hnRNP H2. Relative binding of each mutant to wild-type GRS was set as 1.0 as shown in the histogram. Results are means±S.E.M. for at least three determinations.

