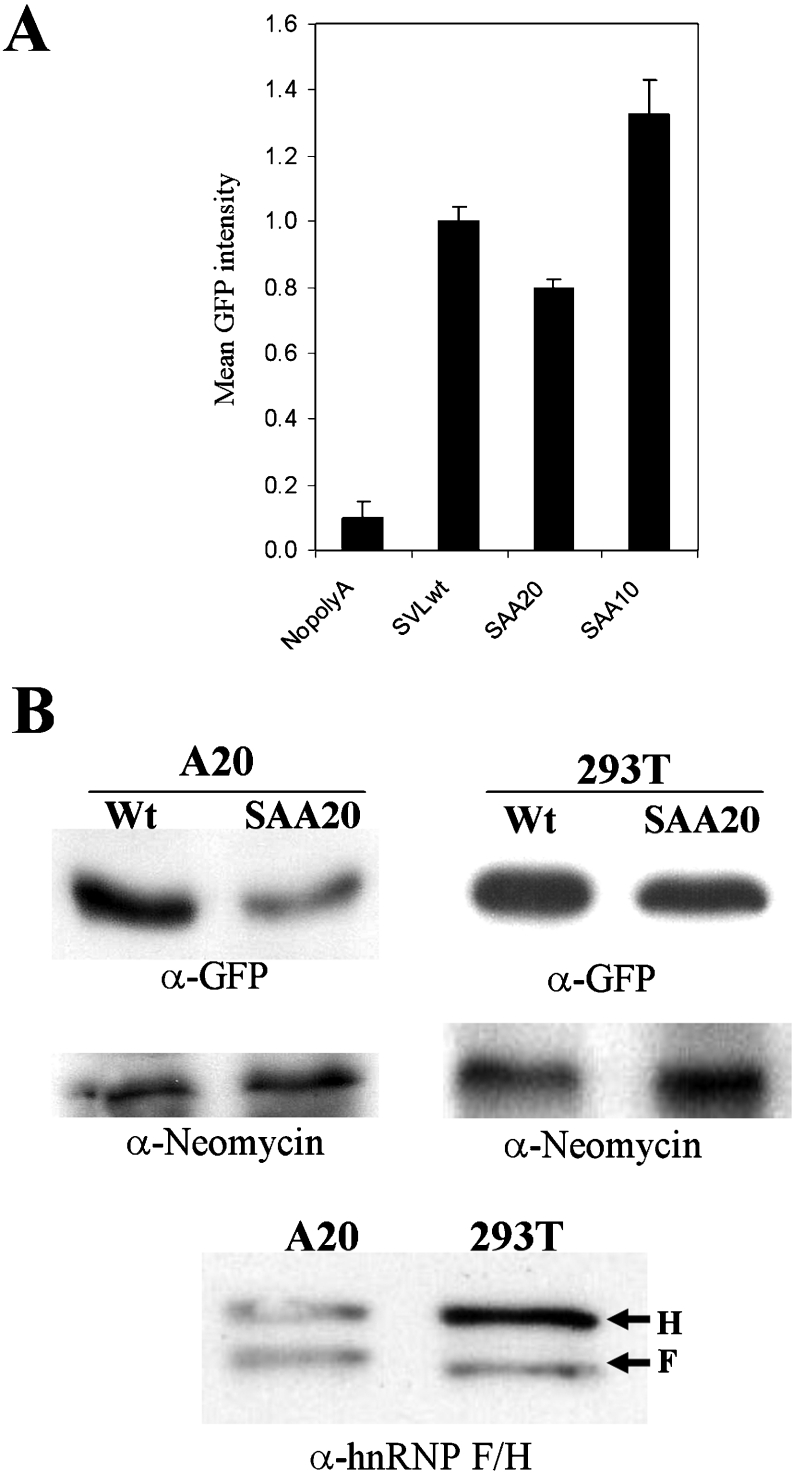
Figure 6. Decreasing the binding of hnRNP F or hnRNP H2 to the downstream region of the GFP transcript reduces the GFP expression in vivo.
(A) Mean GFP fluorescence intensities corresponding to pEGFP-nopoly(A) (NopolyA), pEGFP-wtSVL (SVLwt), pEGFP-SAA20 (SAA20) and pEGFP-SAA10 (SAA10) transfected HEK-293T cells were quantified by flow cytometry. The DsRed fluorescence from a separate plasmid served as a transfection control for normalization (results not shown). Each transfection was performed at least three times, and results are means±S.E.M. (B) GFP levels in pEGFP-wtSVL (Wt) or pEGFP-SAA20 (SAA20)-transfected A20 or HEK-293T cells were determined by Western blots with anti-GFP (α-GFP) antibody. Neomycin encoded on the GFP–plasmid was used for the protein blot loading control (α-Neomycin). Relative hnRNP H and hnRNP F levels in A20 and HEK-293T extracts were detected using a Western blot assay with anti-(hnRNP H) (H) and anti-(hnRNP F) (F) antibodies.

