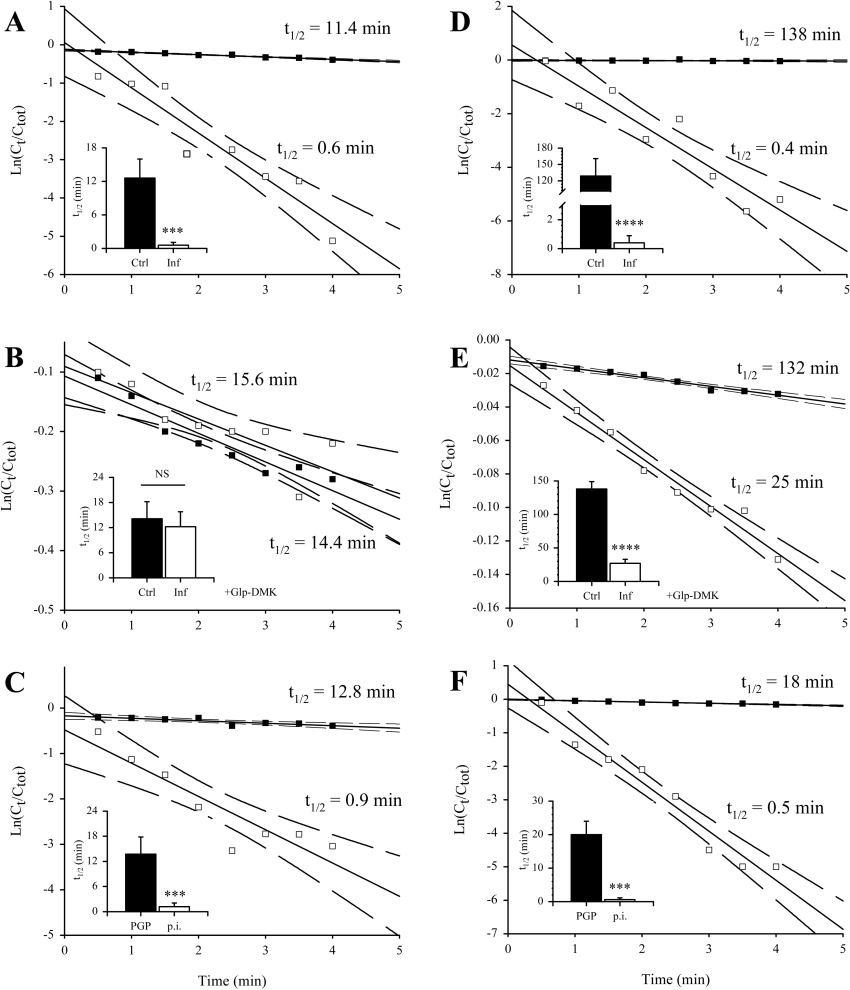
Figure 6. Trypanosome PGP reduces the plasma half-life TRH and GnRH in vitro.
A single representative experiment is illustrated in a scatter plot that shows the loss of radioactive tracer from the plasma, while the insets give the averaged values of three independently determined half-lives for each experimental group. Half-life of [L-His-4-3H(n),L-Pro-3,4-3H(n)]TRH in (A) untreated plasma or (B) plasma treated with Glp-DMK (100 μM; 37 °C, 15 min), from healthy (Ctrl; ■) or infected rats (Inf; □). (C) Half-life of [L-His-4-3H(n),L-Pro-3,4-3H(n)]TRH in plasma from infected rats preincubated with rat antitrypanosome PGP antibodies (PGP; ■) or preimmune rat antibodies (p.i.; □) (100 μg·ml−1; 37 °C, 15 min). (D) Half-life of 125I-Tyr5-GnRH in (D) untreated plasma or (E) plasma treated with Glp-DMK (100 μM; 37 °C, 15 min), from healthy (Ctrl; ■) or infected rats (Inf; □). (F) Half-life of 125I-Tyr5-GnRH in plasma from infected rats preincubated with rat anti-trypanosome PGP antibodies (PGP; ■) or preimmune rat antibodies (p.i.; □) (100 μg·ml−1; 37 °C, 15 min). In the scatter plots, solid lines indicate the regression analysis of the plots, while dashed lines indicate the 95% confidence intervals. In the insets, bars represent the means±S.D. (n=3). NS, not significant; ***P<0.05; ****P<0.001.

