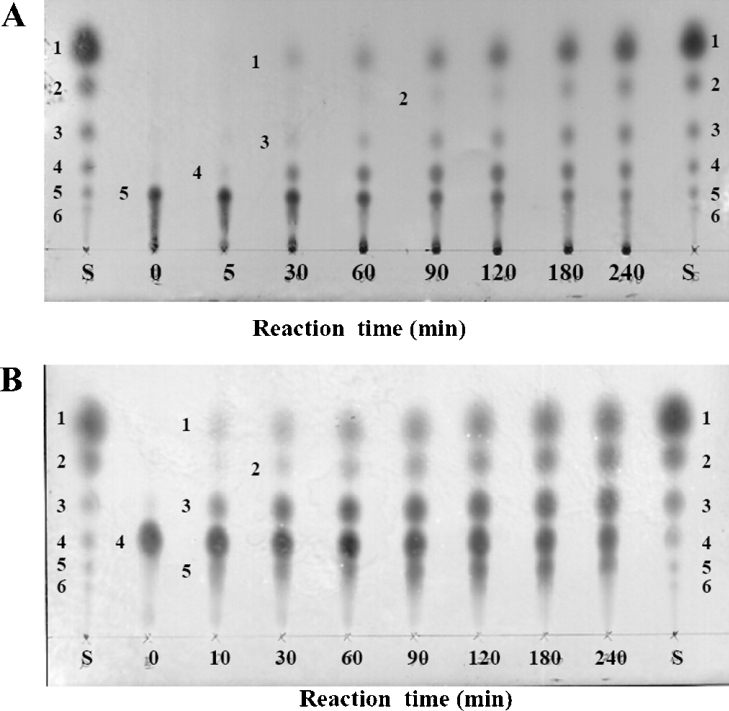
Figure 1. TLC profiles showing the enzymatic hydrolysis of (GlcN)5 (A) and (GlcN)4 (B).
A 3 μl portion of the GlcNase solution (0.48 μM) was added to 100 μl of the substrate solution (12.3 mM) in 50 mM sodium acetate buffer, pH 5.0. The reaction mixture was incubated at 37 °C. Numerals in the chromatogram indicate the degree of polymerization of individual oligosaccharide products.

