


Figure 2. Inhibition of eosinophil peroxidase by nitrite.
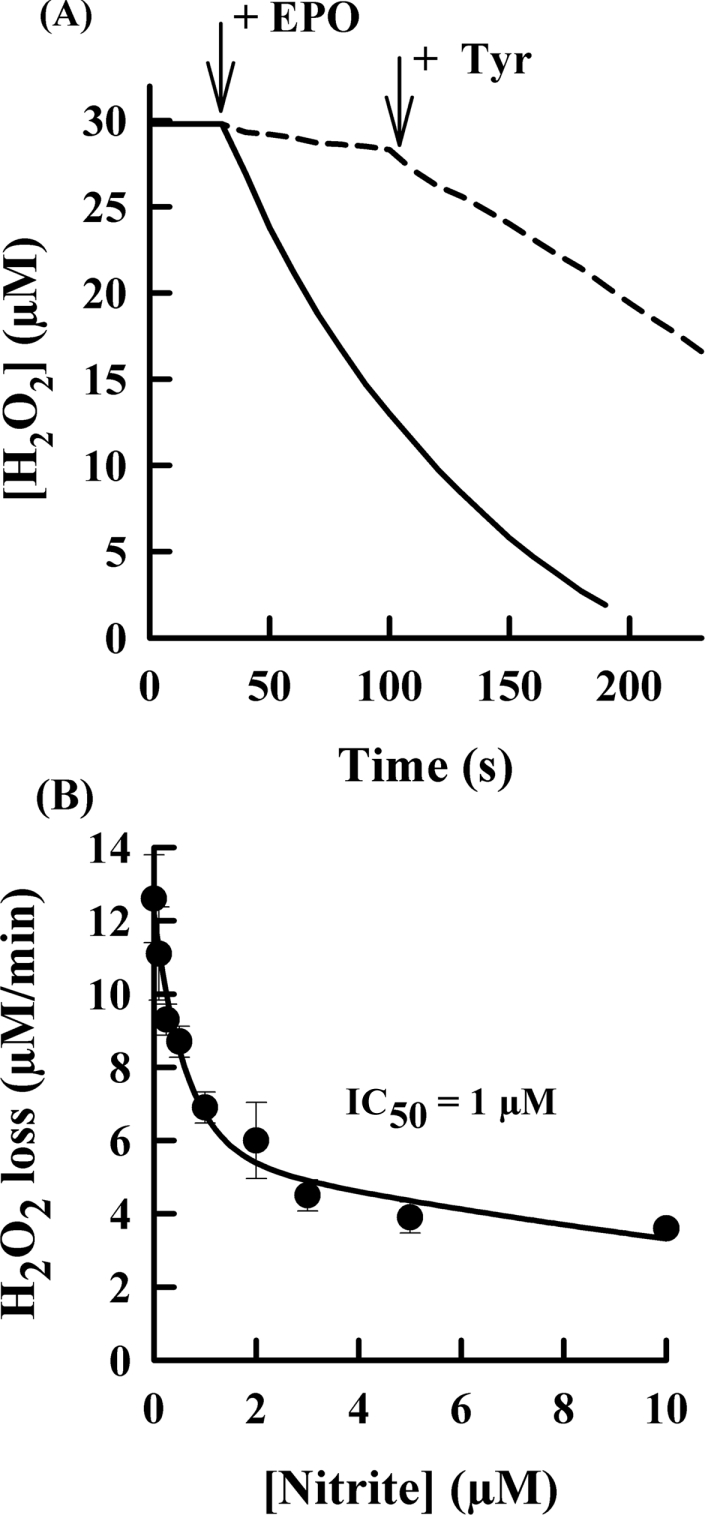
(A) Reactions were started by the addition of 2 nM eosinophil peroxidase (EPO) to 30 μM hydrogen peroxide in 100 mM sodium phosphate buffer (pH 7.4) containing 20 μM DTPA, 100 μM glutathione and 100 μM thiocyanate with (broken line) or without (solid line) 10 μM nitrite. Tyrosine (50 μM) was added where indicated by the arrow. Results are representative of at least duplicate experiments. (B) Reaction conditions were as for (A) except that the concentration of nitrite was varied. Initial rates were calculated over the first 10 s of each reaction. The IC50 was calculated by fitting a rectangular hyperbola to the data by using nonlinear regression. Results are means and ranges for at least duplicate experiments.