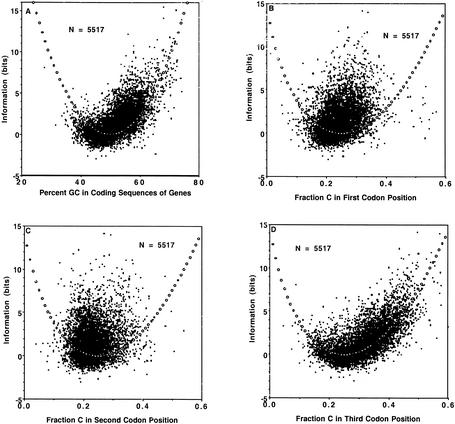
Figure 4.
Relationship of information (bits) and percent GC, in (A) coding sequences of mouse genes; and relationship of information (bits) and C content in (B) first codon position for mouse sequences, (C) second codon position for mouse sequences, and (D) third codon position for mouse sequences. Open circles indicate theoretical fit to the information function.

