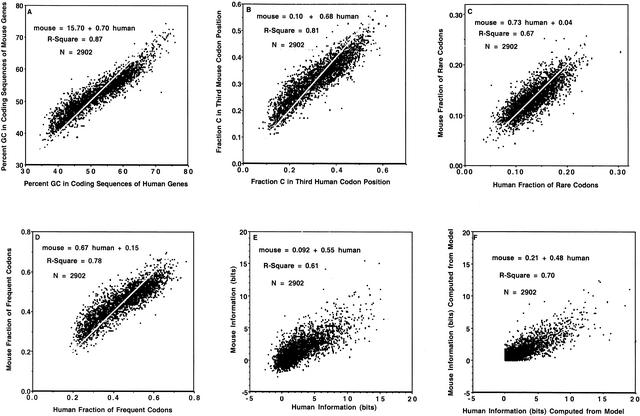
Figure 5.
Relationship of (A) percent GC in coding sequences (white line through data points indicates identity: GC in mouse = GC in human), (B) fraction C in third codon position (white line through data points indicates identity: fraction C in codon position 3 in mouse = fraction C in codon position 3 in human), (C) fraction of rare codons, (D) fraction of frequent codons, (E) information (bits), and (F) model-computed information (bits) in orthologous mouse and human sequences.

