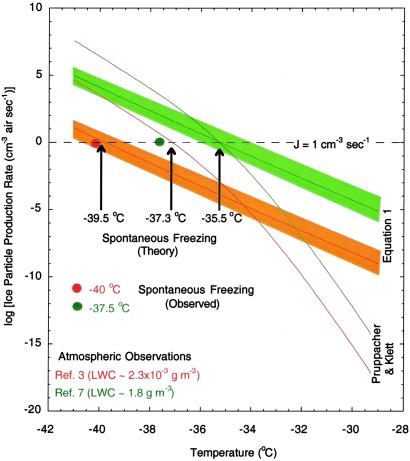
Fig 4.
Ice particle production rates in the atmosphere as a function of temperature and liquid water content. The shaded areas show the range of uncertainties in surface rate predictions based on error bars shown in Fig. 2 for the JS line. The liquid water range used in the calculations varies from 2.3 × 10⁻³ (low) to 1.8 (high) g⋅m−3 and is constrained by aircraft observations (3, 7). A monodisperse size distribution with a mode diameter of 5 and 17 μm was used in the calculations to obtain liquid water surface areas in air for low and high water content measurements, respectively. Arrows mark temperatures at which each theory predicts spontaneous freezing of ice will occur in the atmosphere. Symbols mark temperatures where spontaneous ice freezing was observed in the field.

