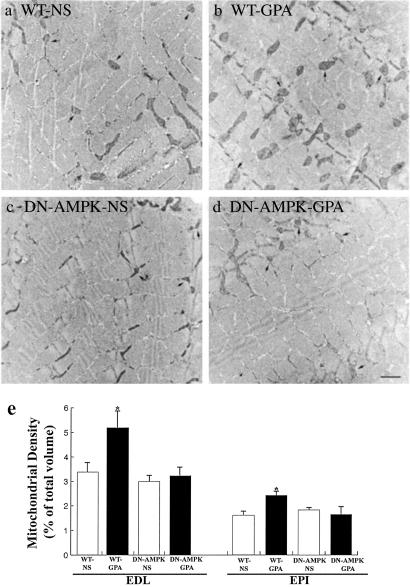
Fig 4.
Effect of GPA treatment on mitochondrial content assessed by electron microscopy of the epitrochlearis (EPI) muscle of (a) WT mouse (saline treated), (b) WT mouse (GPA treated), (c) DN-AMPK transgenic mouse (saline treated), and (d) DN-AMPK transgenic mouse (GPA treated). Arrows point to mitochondria. (Bar, 1 μm.) (e) Mitochondria density (% of total volume) in the extensor digitorum longus (EDL; n = 10 in each group) and EPI muscles of each group mice (n = 5 in each group). *, P < 0.05 compared with other groups.

