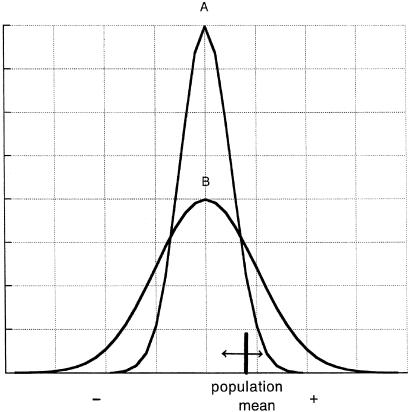
Fig 1.
Schematic diagram showing the frequency distribution of the fitness effects of new mutations. Curve A is for a large population that occupies a heterogeneous environment, and curve B is for a small population that occupies a simple (homogeneous) environment. The population mean moves by drift and selection (modified from ref. 14).

