Fig 3.
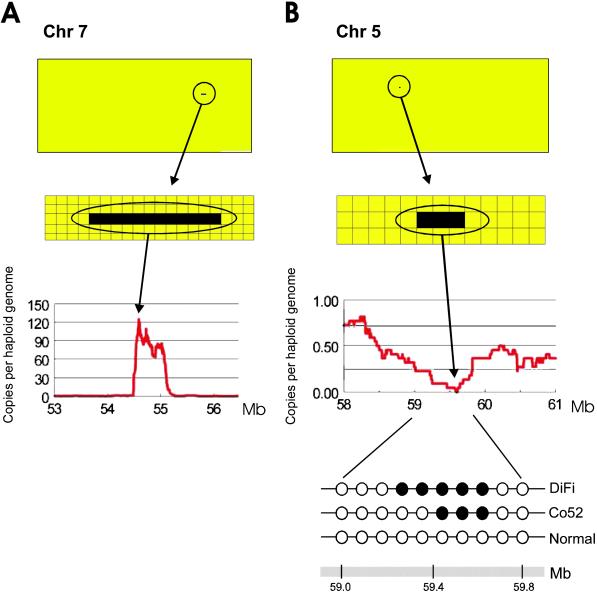
High-resolution tag density maps identify amplifications and deletions. (A) Amplification on chromosome 7. (Top) A bitmap viewer with the region containing the alteration encircled. The bitmap viewer is comprised of ≈39,000 pixels representing tag density values at the chromosomal position of each virtual tag on chromosome 7, determined from sliding windows of 50 virtual tags. Yellow pixels indicate tag densities corresponding to copy numbers of <110, while black pixels correspond to copy numbers ≥110. (Middle) An enlarged view of the region of alteration. (Bottom) A graphical representation of the amplified region with values on the y axis indicating genome copies per haploid genome and values on the x axis representing positions along the chromosome in Mb. (B) Homozygous deletion on chromosome 5. Top, Middle, and Bottom are similar to those for A except that the bitmap viewer for chromosome 5 contains ≈43,000 pixels, tag density values were calculated in sliding windows of 150 virtual tags, and yellow pixels indicate copy numbers >0.1 while black pixels indicate copy numbers ≤0.1. (Bottom) Below the graph is a detailed analysis of the region containing the homozygous deletion in DiFi and Co52. For each sample, white dots indicate markers that were retained, while black dots indicate markers that were homozygously deleted. PCR primers for each marker are listed in Table 4.

