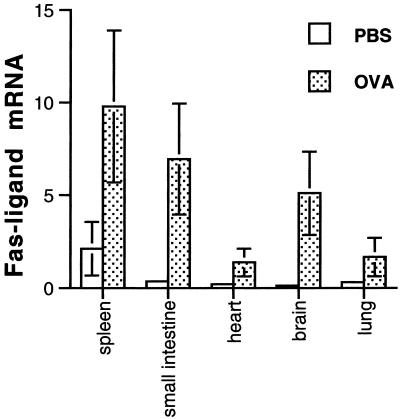
Fig 2.
Tissue distribution and inducible expression profile of nonlymphoid FasL after antigenic challenge in TCR transgenic mice. WT BALB/c and DO11.10 mice were given antigen (OVA 323–339 in PBS) i.v. or PBS alone, and tissues were harvested 24 hours later. FasL mRNA (per microgram total) was quantified by real-time RT-PCR. β-actin was used as an internal control for each respective sample. P < 0.05 by paired t test for all tissues between PBS and OVA treatment. Representative data are shown from triplicate analyses.

