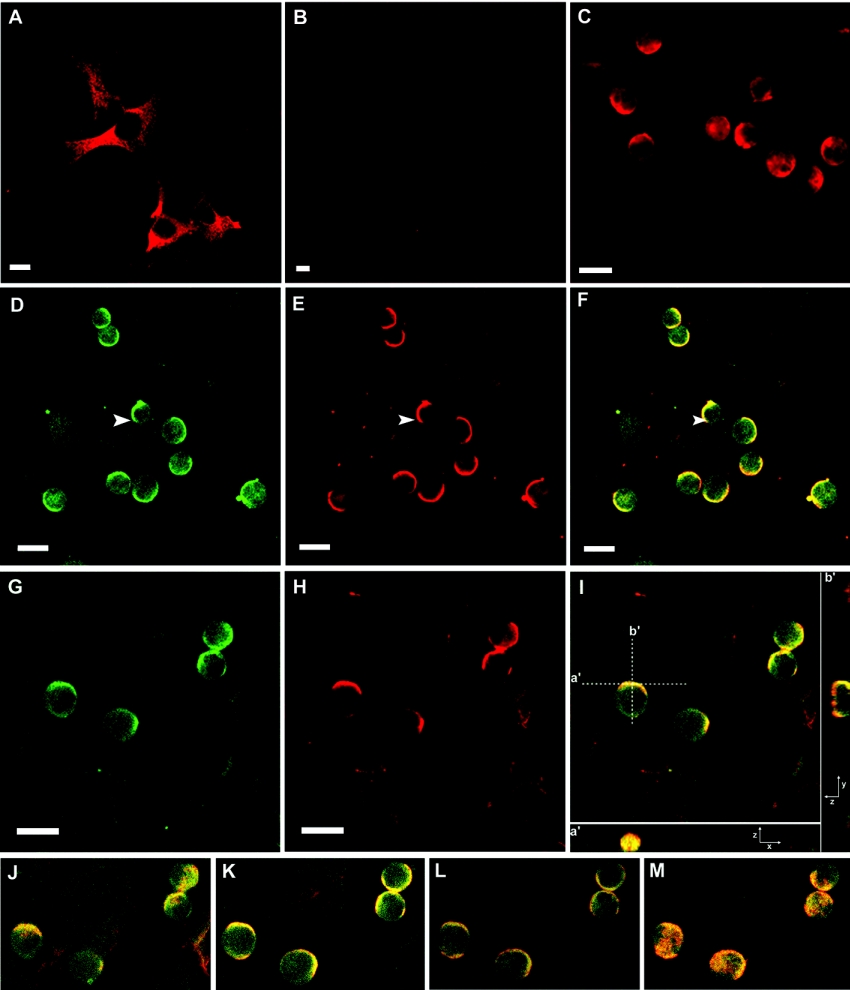
Figure 4. Subcellular location of GM3 and GM-CSF-Rα in cell cultures and co-culture systems.
Cells were immunostained for GM3 with DH2 and immunostained for GM-CSF-Rα with a polyclonal anti-(GM-CSF-Rα) antibody. (A) AFT-024 cells immunostained for GM3. (B) FDC-P1 cells immunostained for GM3. (C) Co-culture immunostained for GM3. (D and G) Co-cultures immunostained for GM3 with monoclonal antibody DH2. (E and H) Co-cultures immunostained for GM-CSF-Rα. (F) Merged image from (D) and (E). (I) Merged image of (G) and (H). Single confocal sections (x, y) of 0.7 μm were taken parallel to the coverslip, except for (I) in which a series of z sections were collected and displayed using the ortho-mode in LSM5 Pascal software provided with the microscope. A single x, y section of the stack is shown in (I). An x, z section (a′) is shown at the bottom of (I) and a y, z section (b′) at the right of (I). (J–M) are single x, y sections from the same z stack of (I) (from bottom to top). The arrows indicate capping of GM3 (D), GM-CSF-Rα (E) and co-capping of GM3 and GM-CSF-Rα (F). Scale bars, 10 μm.

