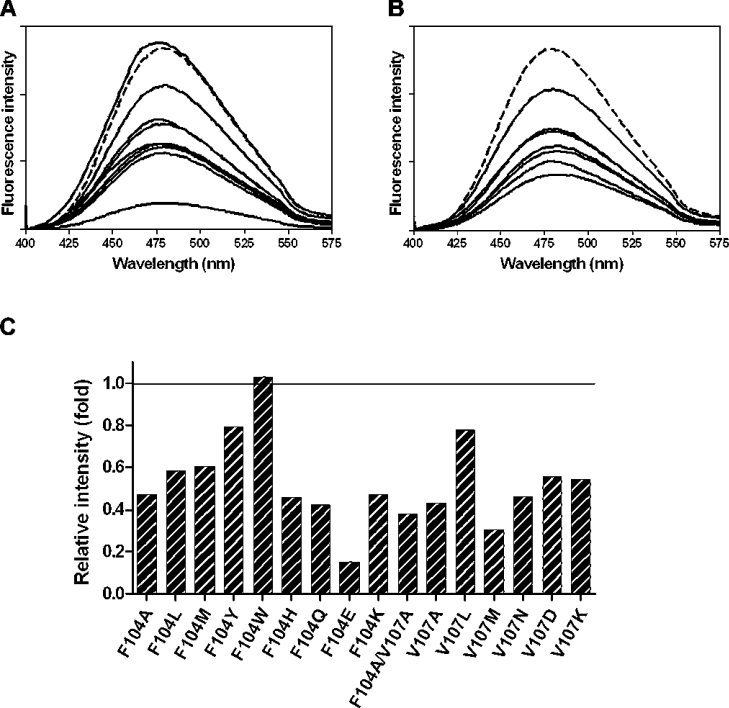
Figure 4. Fluorescence spectrophotometry of ANS binding.
(A) Fluorescence spectra of Phe-104 mutants. (B) Fluorescence spectra of Val-107 mutants. (C) A bar graph representation of relative fluorescence intensity compared with the wild-type enzyme. Fluorescence intensity was measured in arbitrary units. Additional lines illustrate variation between all the engineered GSTs.

