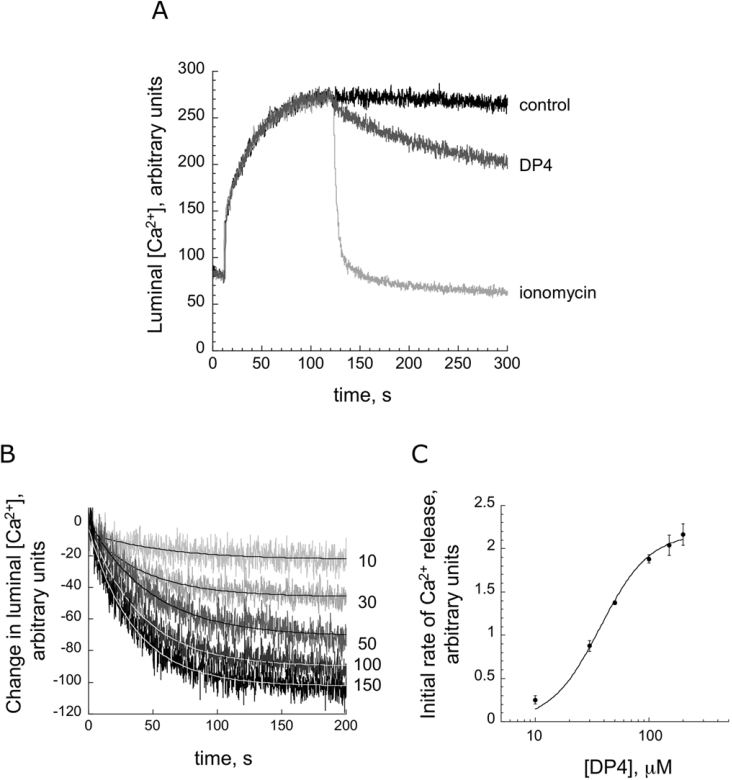
Figure 1. Time course of Ca2+ release induced by various concentrations of DP4.
(A) Time course of Ca2+ flux (100 units of the CTC fluorescence change correspond to a 0.15 mM change in luminal Ca2+). Initial phase corresponds to active uptake of Ca2+ following addition of MgATP (at t=10 s). Fluorescence intensity subsequently decreased owing to passive Ca2+ leak into the BAPTA-buffered extra-vesicular solution (control trace). Ca2+ efflux is accelerated when RyR agonists are added (50 μM DP4 was added at t=90 s). The Ca2+ gradient is rapidly ablated by the addition of 1 μM ionomycin. (B) Time courses of Ca2+ released from SR vesicles at various DP4 concentrations. External Ca2+ was held at 0.1 μM. Following subtraction of control data, traces were fitted to equations of the form y=A·e−kt+yo, where A is the maximum amount of Ca2+ release, k is the rate constant of Ca2+ release and t is time. (C) Plot of A·k (initial rate of release) against DP4 concentration.

