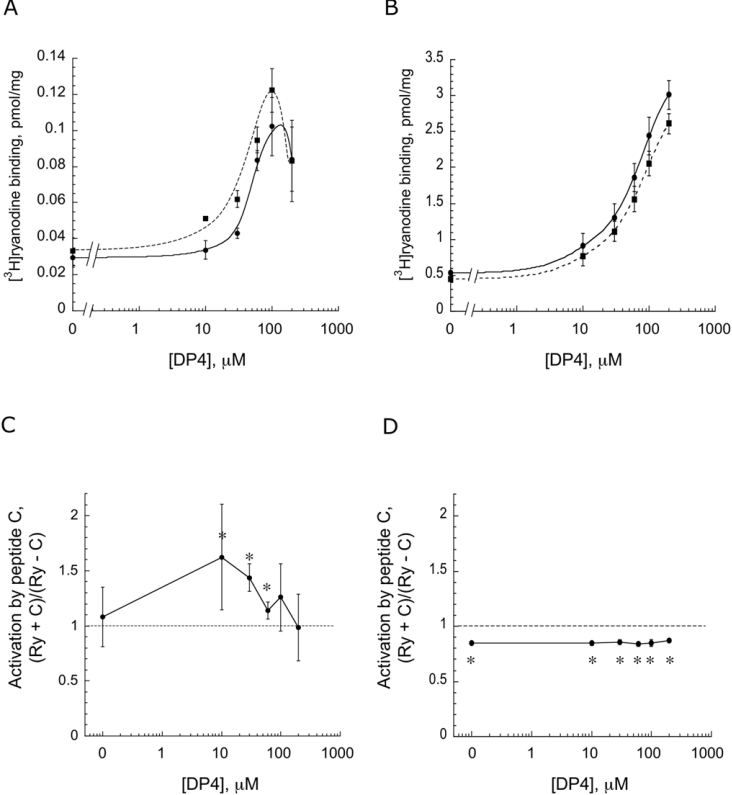
Figure 3. Activation of [3H]ryanodine binding versus DP4 concentration.
[3H]Ryanodine-binding assays were performed in the absence or presence of 50 μM peptide C at various concentrations of DP4 in 0.1 μM Ca2+ (A) and 10 μM Ca2+ (B). Data points represent the means±S.E.M. of n=4 assays. Ratios of ryanodine binding with peptide C (Ry+C) to ryanodine binding of control (Ry-C) at each DP4 concentration are also shown (C, D).

