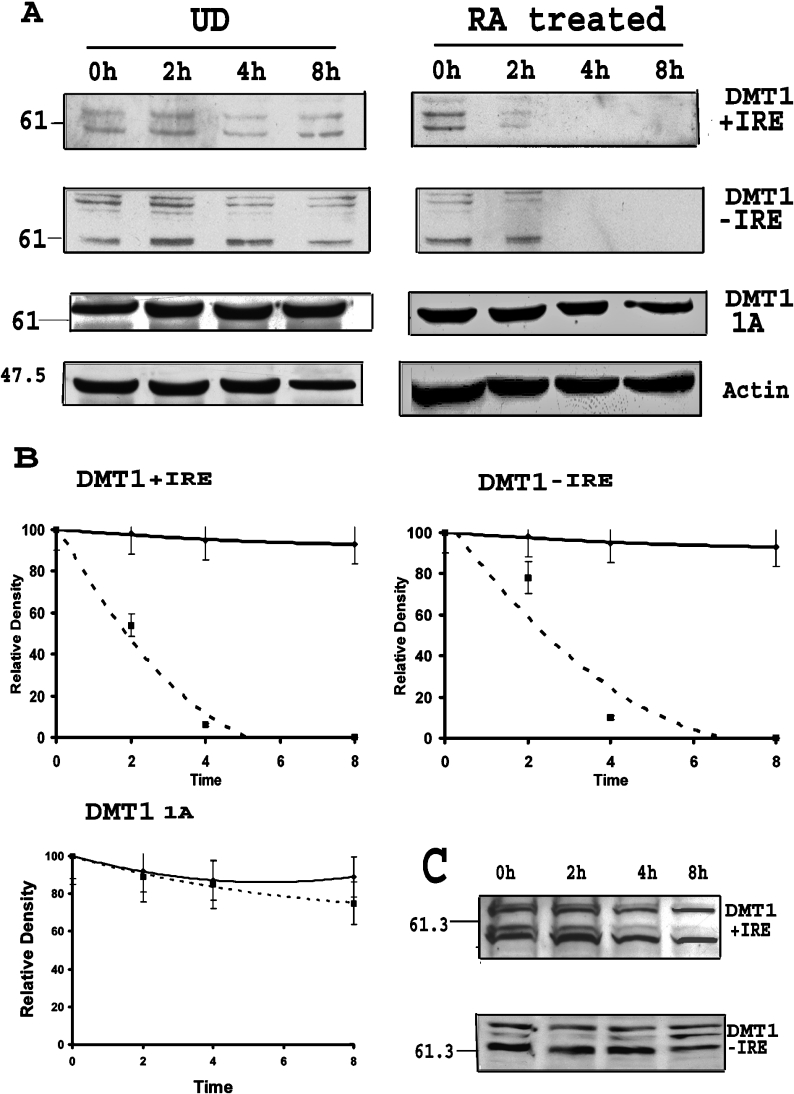
Figure 3. Increased turnover of specific DMT1 isoforms after RA removal.
(A) Representative Western-blots showing the turnover of DMT1 isoforms after RA removal as compared with undifferentiated cells (UD). See the Experimental section for details. The left panel shows turnover of protein in undifferentiated cells, while the right panel shows that of cells treated with RA for 4 days. The decrease in +IRE and −IRE isoforms was earlier in cells first treated with RA as compared with undifferentiated cells, indicating faster turnover. (B) Graphical representation of band densitometry (band around 61 kDa) from Western-blots for protein turnover. The solid line represents undifferentiated cells, while the dotted line represents cells treated with RA. The graph shows that half-life of +IRE and −IRE DMT1 was decreased in cells after RA treatment as compared with that of undifferentiated cells. There is no significant change in half-life of 1A isoforms of DMT1. Results are presented as means±S.D. for three Western-blots. (C) Western-blot for turnover of DMT1 +IRE and −IRE isoforms during RA treatment. CHX (20 μg/ml) was added to the cells during RA treatment on day 4 and lysates were collected at 0, 2, 4 and 8 h. There was no change in the turnover of proteins as compared with the undifferentiated cells as shown in (A).

