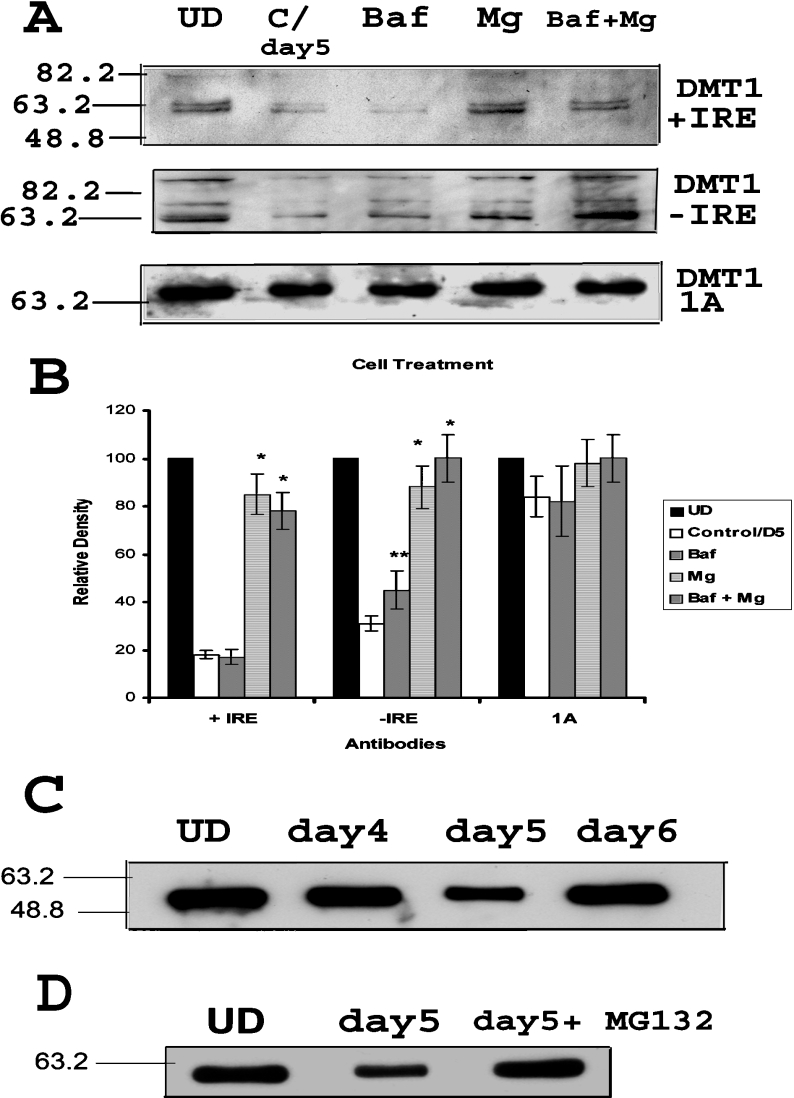
Figure 4. DMT1 degradation occurs via both lysosomal and proteasomal pathways after RA removal.
(A) Representative Western-blot showing down-regulation of +IRE and −IRE isoforms after removal of RA (C/day5, lane 2), as shown before. Incubation of the same cells with MG-132 (10 μM) and/or bafilomycin A1 (500 nM) for 10 h prevents the decrease in specific isoforms. Western-blot for 1A does not show any significant change with any treatment. (B) Graphical representation of band densities (band around 63 kDa) from three Western-blot experiments as above. The relative density of bands from each cell treatment is indicated for specific DMT1 isoforms. Results are presented as means±S.D. for three Western blots. Two-tailed t test was performed. *Significant difference from only RA-treated cells with P<0.001; **Significance with P<0.05. (C) Western-blot showing that the down-regulation of α-tubulin after removal of RA (day 5) as compared with undifferentiated cells (UD). The expression is partially restored by day 6. (D) Western-blot showing that the down-regulation of α-tubulin after removal of RA (day 5) was reversed when the cells were incubated with MG-132 (10 μM) for 10 h.

