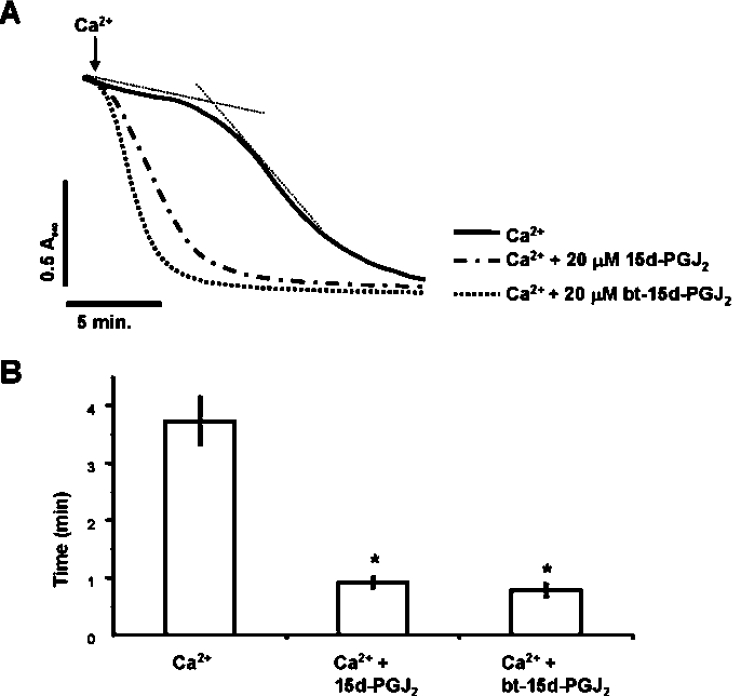
Figure 8. Ca2+-induced PT is not modified by the biotin tagging of 15d-PGJ2.
Mitochondria (1 mg/ml) were incubated in the spectrophotometer in swelling buffer with succinate (5 mM) and rotenone (1 μM). (A) The same concentration (20 μM) of 15d-PGJ2 or bt-15d-PGJ2 was present from the beginning of the experiment and Ca2+ (80 μM) was added at 2 min. Lag time (after the addition of Ca2+) was calculated as described in Figure 1. Data are single traces representative of 3–6 individual experiments. (B) Data represent the mean times of maximum swelling±S.E.M. for 3–6 individual experiments. *, P<0.001 versus control (Ca2+ only).

