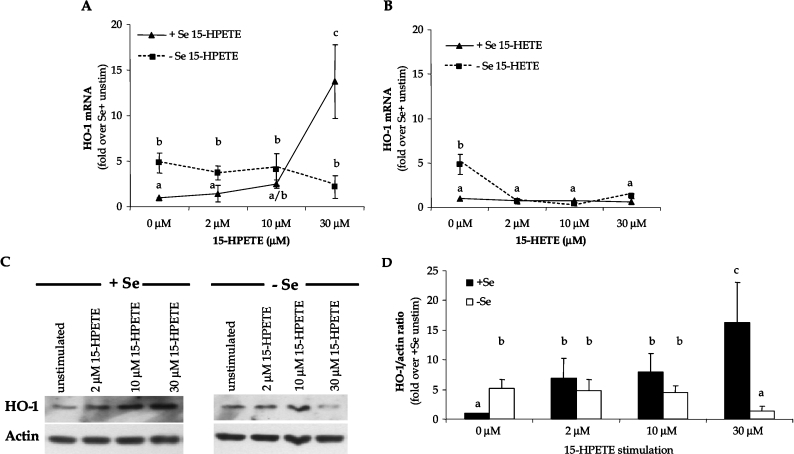
Figure 2. Differential levels of HO-1 expression in +Se and −Se BAECs following 15-HPETE stimulation.
Following stimulation of ECs with dose titration of (A) 15-HPETE or (B) 15-HETE for 2 h, total RNA was isolated, and QC RT–PCR for HO-1 mRNA was then performed. PCR products were separated on a 2% agarose gel, and densitometry of HO-1 mRNA was measured. Results are expressed as fold increase of HO-1 mRNA over +Se unstimulated BAECs (unstim) and are means±S.E.M. for three separate experiments. (C) Following stimulation of ECs with dose titration of 15-HPETE for 2 h, whole-cell lysates were harvested, and equal amounts of protein were resolved by SDS/12% PAGE for Western blot analysis. (D) Densitometry results from three separate experiments in (C) were averaged and means±S.E.M. for three separate experiments are shown. Values denoted by different lower-case letters are statistically different from each other (P<0.05) as determined by ANOVA.

