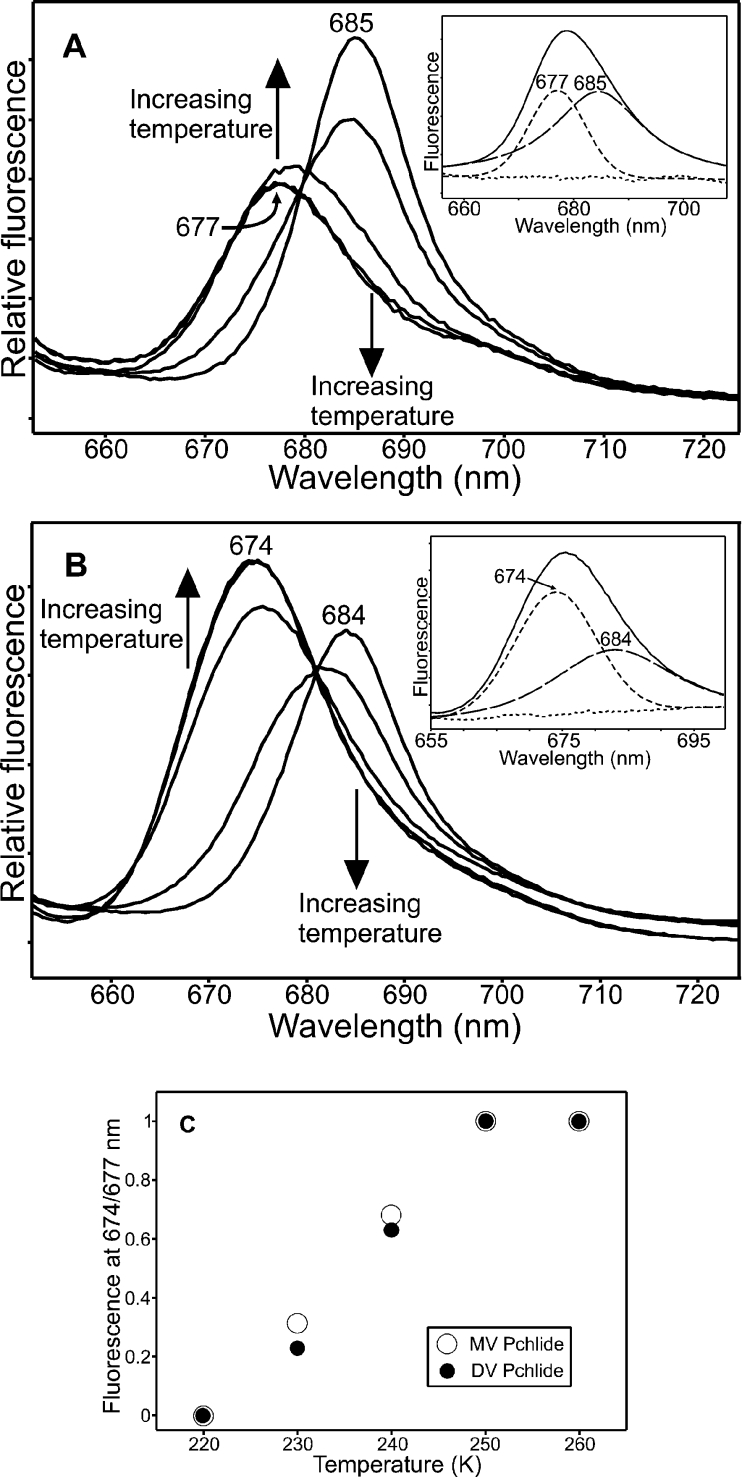
Figure 3. Spectroscopic characterization of the second ‘dark’ step of the reaction for MV and DV Pchlides.
The 77 K fluorescence emission spectra of samples containing 1.1 μM MV Pchlide (A) or DV Pchlide (B), 30 μM POR and 200 μM NADPH after illumination for 10 min at 185 K and incubation in the dark for 10 min at 220, 230, 240, 250 and 260 K are shown. The arrows indicate the formation of a fluorescent band at either 677 nm (MV Pchlide) or 674 nm (DV Pchlide) and the disappearance of the fluorescent band at either 685 nm (MV Pchlide) or 684 nm (DV Pchlide) at increasing temperatures. Spectra were recorded with an excitation wavelength of 450 nm. The respective insets show deconvolutions of the 240 K spectra with the residuals represented by the small dotted lines. (C) The temperature dependence of the second ‘dark’ step was calculated by measuring the relative increase in fluorescence at either 677 nm (MV Pchlide) or 674 nm (DV Pchlide) over the temperature range 220–260 K.

