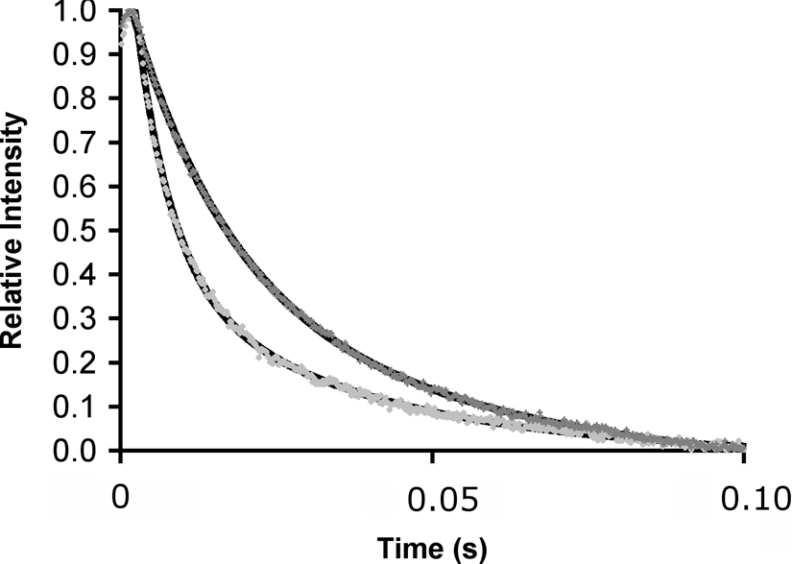
Figure 2. Fluorescence energy transfer during DHFR catalysis.
Measurement of the rate of H- (light grey dots) and D- (dark grey) transfer catalysed by DHFR in a single turnover experiment measured by stopped-flow fluorescence resonance energy transfer from DHFR to the reduced cofactor at 25 °C. The relative intensity of fluorescence above 400 nm was measured after excitation at 292 nm. The fits to a double-exponential model for decreasing fluorescence intensity are also indicated. DHFR was preincubated with NADPH or NADPD and the reaction started through the addition of H2F. Final concentrations were: DHFR, 40 μM; reduced cofactor, 20 μM and H2F, 200 μM. The dead time of the experiments was approx. 0.002 s.

