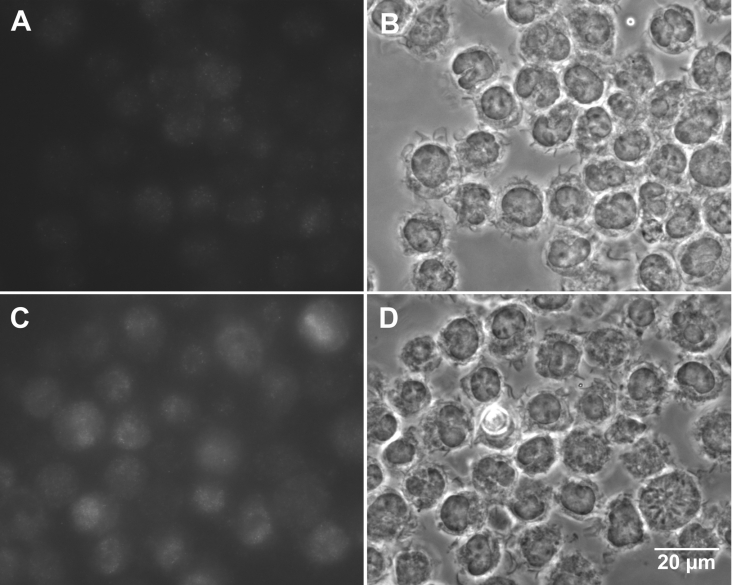
Figure 2. Immunocytochemical demonstration of MT up-regulation.
Compared with control cells (A, B), cells exposed for 12 h to 100 μM Zn under otherwise standard conditions (C, D) showed elevated levels of MT I and II. Immunofluorescence (A, C) and phase contrast (B, D) images are shown. Micrographs were taken with fixed settings. The lighter background in (C) compared with (A) is an effect of a stronger light scattering from the fluorescence-emitting cells with up-regulated MT.

