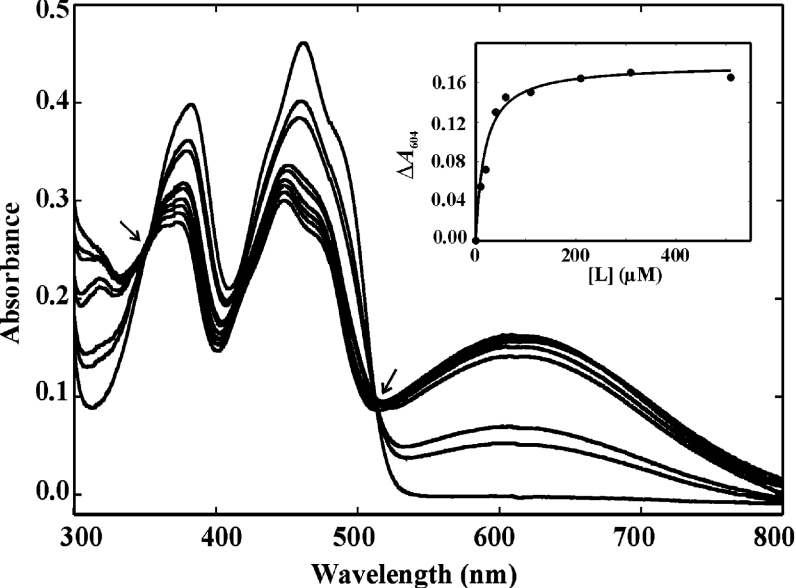
Figure 2. Spectral changes in SYE4 upon titration with p-chlorophenol.
Absorbance spectra were recorded between 300 and 800 nm in 0.1 M Tris/HCl, pH 8, at 22 °C. SYE4 (40 μM) was titrated with 0, 10, 20, 40, 60, 110, 210, 310 and 510 μM of p-chlorophenol. The long-wavelength transition that appeared with increasing ligand concentration has an absorbance maximum that is centred at 604 nm. The isosbestic points at 354 and 512 nm are indicated by arrows. The inset shows the SYE4–ligand complex formation (ΔA604) as a function of ligand concentration ([L]). The data points were fitted to the hyperbolic equation ΔA=ΔAmax/1+(Kd/[L]) from which the dissociation constant Kd was determined using SigmaPlot.

