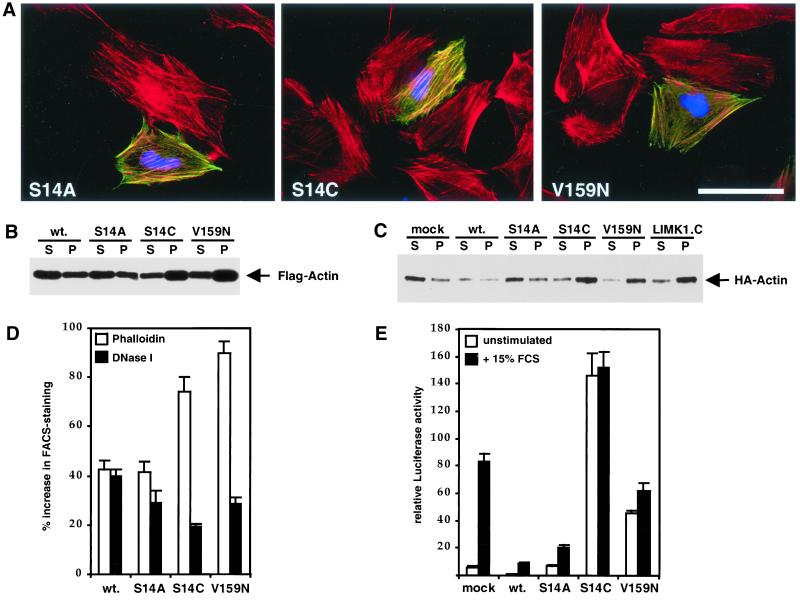
Figure 6.
Actins V159N and S14C stabilize F-actin and activate SRF. (A) Actins V159N and S14C colocalize with endogenous F-actin structures. NIH3T3 cells were transiently transfected with expression plasmids encoding FLAG-actin or mutant derivatives and subjected to brief extraction with 0.5% Triton X-100 before fixing and staining as in Figure 2. The Figure shows a merge of transfected actins (anti-FLAG; green), total F-actin (rhodamine-phalloidin; red), and transfection marker (anti-LexA; blue). Bar, 50 μm. (B) Actins V159N and S14C accumulate preferentially in the Triton X-100–insoluble fraction. Extracts of cells expressing the indicated FLAG-tagged actin mutants were prepared and separated into 100,000-g supernatant (S) and pellet (P) fractions as described in MATERIALS AND METHODS; equal amounts were separated by SDS-PAGE and FLAG-actin in each fraction was detected by immunoblotting with anti-FLAG antibodies. (C) Actins V159N and S14C copolymerize with wild-type actin and decrease its detergent solubility. Extracts were prepared from cells expressing the indicated actins, or the catalytic domain of LIMK1, together with HA-tagged wild-type actin and fractionated as in B before detection of HA-actin in each fraction by immunoblotting with anti-HA antibodies. (D) Expression of actins V159N and S14C increases F:G-actin ratio. Cells were transfected with expression plasmids encoding the indicated actins and fixed and stained for the FLAG epitope and either F-actin, with phalloidin, or G-actin, with DNase I. The levels of F-actin or G-actin in the transfected population were then quantitated relative to the untransfected population by using FACS, as described in MATERIALS AND METHODS. Bars represent the increase in mean relative F-actin (±SEM, n = 4) or G-actin (± half range, n = 2) contents. (E) Expression of actins V159N or S14C activates SRF in the absence of extracellular signals. NIH3T3 cells were transfected with expression plasmids encoding the indicated FLAG-tagged actins together with the SRF reporter gene 3D.ALuc as described in MATERIALS AND METHODS. After serum stimulation, luciferase activities were measured and expressed relative to activation by SRF-VP16, taken as 100. Data show mean of at least four independent experiments with SEM indicated by the bars.

