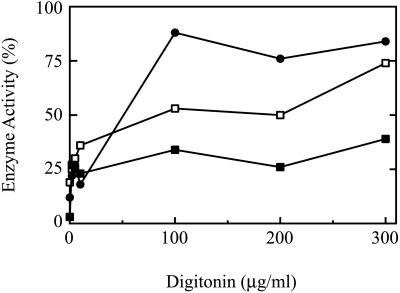
Figure 3.
Catalase latency. IMR90 HDFs were treated with increasing concentrations of digitonin, and the levels of catalase (▪) and lactate dehydrogenase (●) were determined. Data are presented as percentage of total cellular activity (set at 100), which was determined in the presence of 1% Triton X-100. Solid symbols, early-passage cells; open symbols, late-passage cells.

