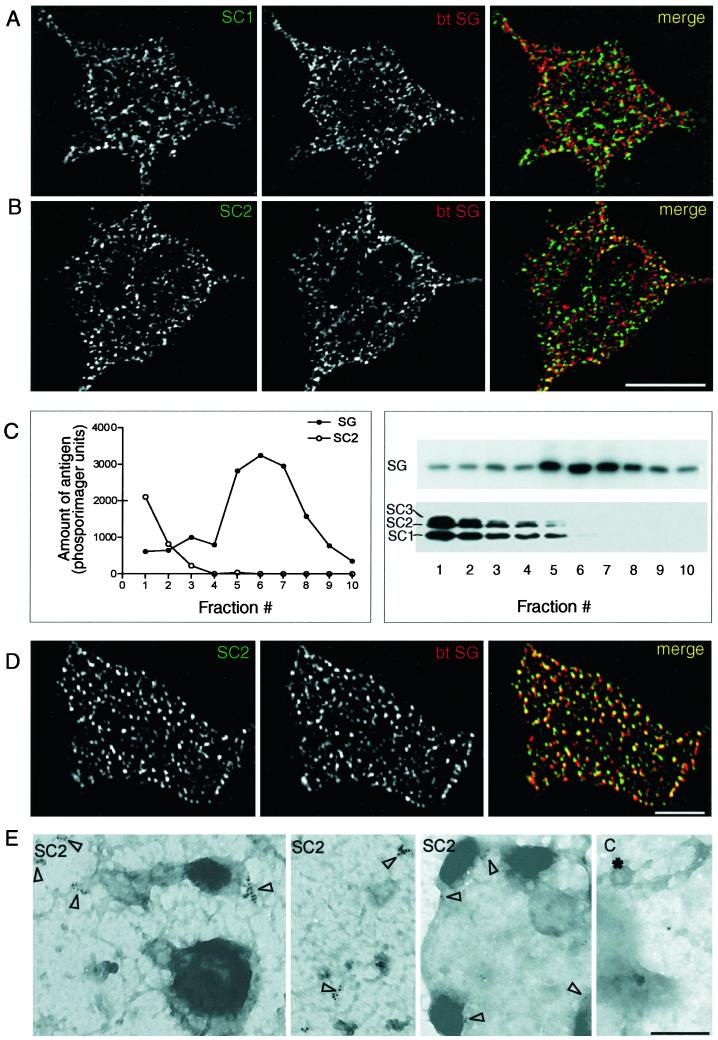
Figure 2.
.Localization of SCAMPs 1 and 2 in PC12 cells. (A and B) Double-label immunofluorescence images showing the distributions of the two SCAMPs (stained with antibodies 1ω and 2τ and Alexa 488-tagged secondary antibody) compared with secretogranin (SG; stained with biotinylated anti-SG and avidin-Alexa 594). A digitally deconvolved section (0.2 μm) including an unstained nuclear profile is shown in each case. Bar, 10 μm. (C) Distribution of SCAMPs compared with secretogranin in large dense-core vesicles purified by gradient centrifugation. Plots of SG and SC2 are intensity profiles of bands from Western blots probed with anti-SG and anti-SC2 (2τ), detected with 125I-labeled secondary antibody, and analyzed by phosphorimaging. The accompanying Western blots show the distribution of SG and of SCAMPs 1–3 as detected by mAb 7C12 and enhanced chemiluminescence. (D) Distributions of SCAMP2 and SG as observed on plasma membrane sheets (Lang et al., 2001) using double-label immunofluorescence (antibodies as in B). The bar corresponds to 5 μm. (E) Immunogold-stained electron microscopic images showing multiply labeled SCAMP2 foci (open arrowheads) on plasma membranes torn from the upper cellular surface. Primary antibody 2τ was used. The fourth panel, labeled C, is a negative control showing an occasional solitary gold particle when primary antibody staining was omitted. * identifies a clathrin-coated pit; bar, 0.2 μm.

