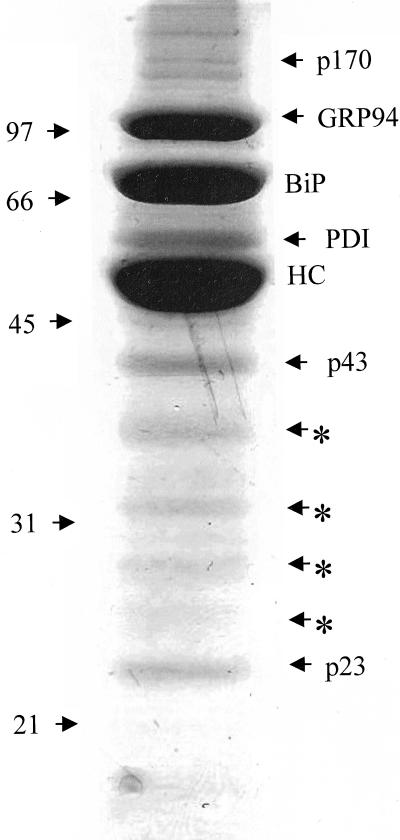
Figure 3.
Coomassie staining of the proteins of the complex for isolation and identification. Then 300 × 106 Ag8(8) cells were treated with 150 μg/ml DSP. The postnuclear fraction was prepared, and Ig heavy chains and associated proteins were isolated with protein A-Sepharose, which were separated by reducing SDS-PAGE on a 10% acrylamide gel. The gel was then Coomassie stained and protein bands were isolated and submitted to mass spectrometry analysis. The arrows shows all the proteins analyzed and the asterisk (*) shows degradation products from the heavy chain.

