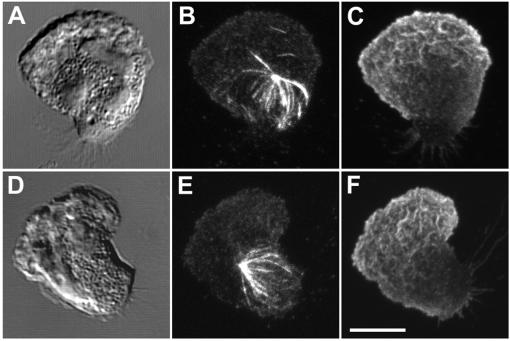
Figure 3.
Reorientation of the MT array in the presence of taxol. PMNs were plated on fibronectin (Fn)-coated coverslips, preincubated with 1 μM taxol for 30 min, and stimulated with 10 nM fMLF for various times. The MT array (B and E) and actin cytoskeleton (C and F) were visualized by confocal microscopy. Differential interference contrast image (A and D). Fluorescent images represent Z-axis confocal projections 2 min after fMLF stimulation (A–C) or 4 min after fMLF stimulation (D–F). Bar, 5 μm.

