
Figure 2.
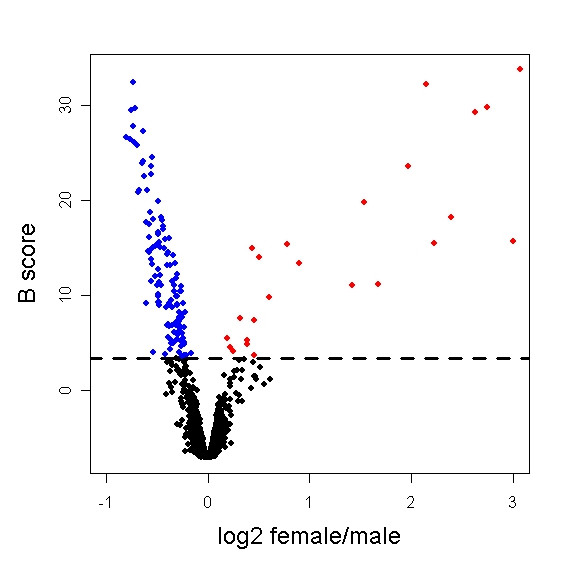
Microarray analysis of gene expression differences between female and male chicken embryos across four embryonic stages (ed4, 6, 8 and 10) in the whole head (ed4 and 6) and brain (ed8 and 10). The volcano plot shows the magnitude of differential expression (log2 female/male ratio) versus the posterior log odds of differential expression (B score) for each of 10,702 microarray clones (each represented by a dot) included in the analysis (see Methods). The horizontal line marks the threshold (B score > 3.413) for selecting a clone as significantly (adjusted p-value < 0.0005) more highly expressed in males (blue) or females (red).