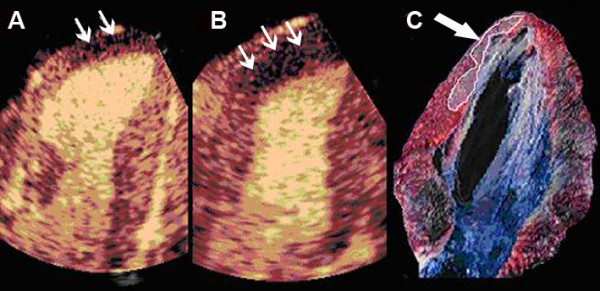
Figure 3.

Representative example of real-time myocardial contrast echocardiography images showing lack of perfusion that corresponds to infarcted area before (A) and during adenosine infusion (small arrows) (B). Note that adenosine increases the infarct size determination. Necrotic area was determined as the region that failed to demonstrate brick red staining, appearing pale yellow, by triphenyl-tetrazolium chloride staining (arrow) (C).
