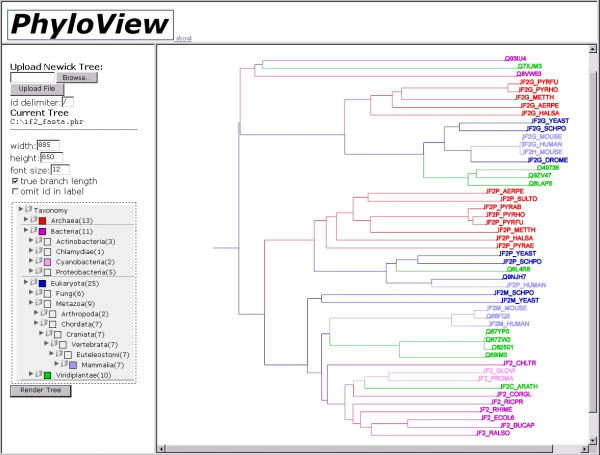
Figure 1.
PhyloView web interface. The phylogenetic tree is input on the top left window. Bottom-left: summary of the taxonomic levels present in the tree (with number of sequences in each within brackets) that can be expanded and contracted at will. A colour picker allows the association of a colour with any taxonomic level. Right: interpretation of a tree. In this example, a multiple sequence alignment of putative transcription initiation factor 2, gamma subunit, and related sequences, is used to illustrate PhyloView (the example is available at the web site). Colouring chosen is: Archaea:red; Bacteria:pink; Cyanobacteria:light pink; Eukarya:blue; Viridiplantae:green; Mammals:light blue. Repeating phylogenetic structures make obvious the existence of two subfamilies (IF2G, and a hypothetical IF2P), and the presence of three outliers (top: three GTPases of unknown function, wrongly included in the alignment). The plant sequence that groups with the Cyanobacteria (IF2C_ARATH) is a chloroplast IF2G. The eukaryotic members that group with bacteria (IF2M) are mitochondrial IF2Gs. Recent duplications of mammalian IF2Gs are also apparent.

