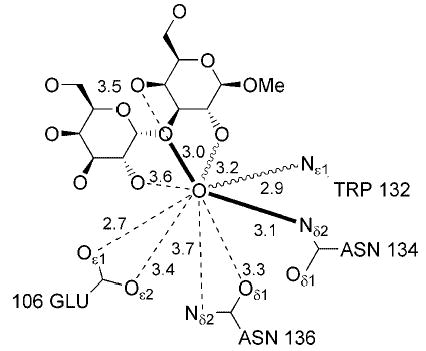
Fig. 7. Hydrogen bonding interactions involving the complexed water from the 2-ns MD simulation.

Boldface lines represent interactions present in both conformations. The dashed lines represent interactions taking place only in configuration E, and the wavy lines represent interactions taking place only in configuration W.
