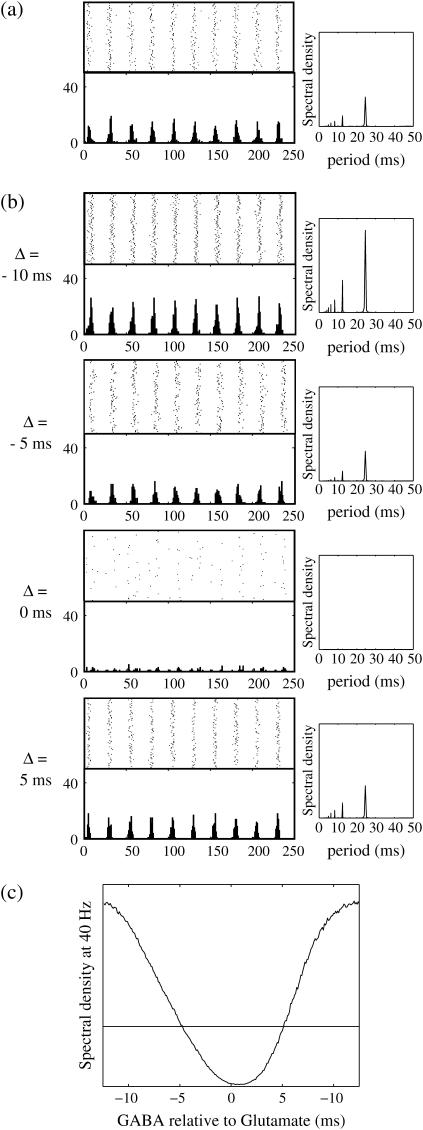
FIGURE 10.
Phase-to-amplitude transformation by a population of neurons. (a) Raster plot (upper left panel) and histogram (lower left panel) of a neuronal population composed of 100 neurons receiving the common 40 Hz glutamatergic input train with 5% of independent fluctuation on its amplitude, timing, and duration, in the absence of GABAergic inputs. The parameters are T = 25 (ms),  (ms), and
  (nS), giving a 1:2 phase-locked response, i.e., 20 Hz firing in the absence of GABAergic inputs and also without fluctuation on glutamatergic inputs. The right panel shows the power spectrum (vertical axis) versus the period (horizontal axis) obtained by fast Fourier transformation. (b) Raster plots, histograms, and Fourier spectra of 100 neurons receiving 40 Hz glutamatergic input train and depolarizing GABAergic trains with
  (mV) and
  (nS), both of which contain 5% of fluctuations on their amplitudes, timings, and durations. Four cases are shown: the temporal difference between glutamatergic input and GABAergic input is, from top to bottom, −10, −5, 0, and 5 ms. (c) Dependence of the power spectrum of the population activity at 40 Hz on the time difference between glutamatergic and GABAergic periodic input trains. The horizontal black line indicates the value in the absence of GABAergic inputs for comparison.

