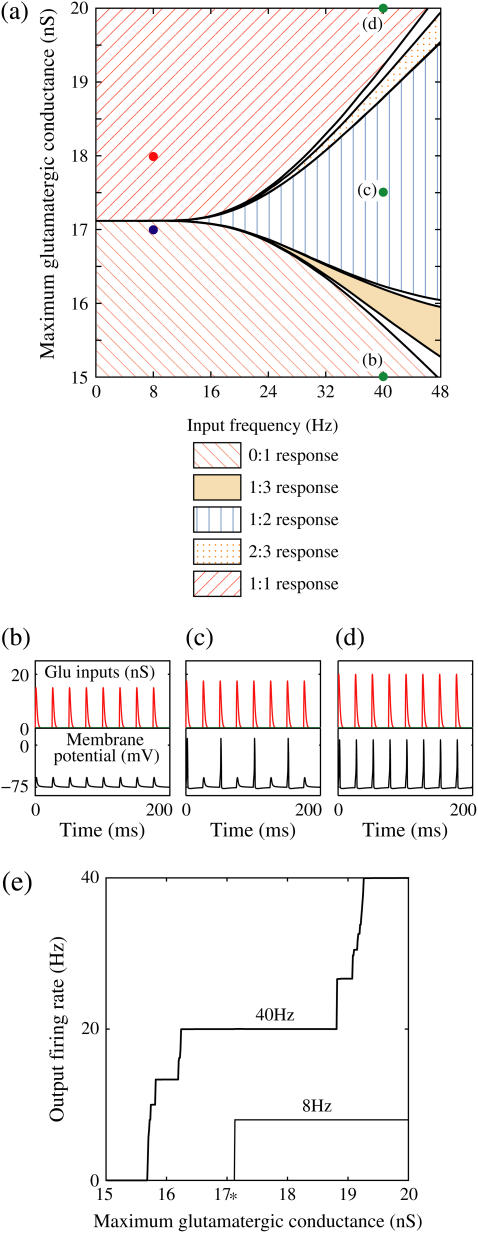
FIGURE 2.
Neuronal responses to periodic glutamatergic inputs in the absence of GABAergic inputs: simulation and bifurcation analysis. (a) The bifurcation diagram of the case with only glutamatergic input calculated with respect to two parameters, the frequency 1/T indicated by the horizontal axis and the maximum conductance  indicated by the vertical axis, under the fixed value of the time constant
  (ms). Solid lines indicate saddle-node bifurcation curves. Different phase-locked solutions are indicated by different symbols as shown below the figure. These symbols are used throughout this article. The blue spot and the red spot indicate the parameter values used as the subthreshold and suprathreshold inputs for bifurcation analyses (see text for details). (b–d) Glutamatergic input conductances (top panels) and resulting wave forms of the membrane potential (bottom panels) at the three points on the
  parameter plane indicated by green circles in panels a–d correspond to 0:1, 1:2, and 1:1 phase-locked solutions, respectively. (e) The relationship between the
  (the maximum conductance of the driving glutamatergic input) and the output firing frequency for the T = 25 (ms) (i.e., 40 Hz) and the T = 125 (ms) (i.e., 8 Hz) cases calculated from numerical simulation of Eqs. 1 and 2. The asterisk indicated the critical strength of the glutamatergic inputs for T = 125 (ms) (i.e., 8 Hz).

