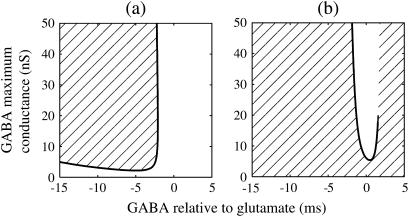
FIGURE 3.
Bifurcations associated with the excitatory and inhibitory actions of GABA. The bifurcation diagrams were calculated with respect to two parameters, the time (phase) difference Δt between glutamatergic and GABAergic inputs, indicated by the horizontal axis, and the maximum conductance  of the GABAergic inputs, indicated by the vertical axis. The time constants are fixed at
  (ms), and the periods are fixed at T = 125 (ms) (i.e., 8 Hz), which approximates the situation of the transient inputs (see text). The maximum conductance of the glutamatergic inputs is fixed either at the subthreshold value
  in panel a or the suprathreshold value
  in panel b. Solid lines represent numerically calculated saddle-node bifurcation curves. The shadowed areas represent the regions where the 1:1 phase-locked solution representing full firing of the neuron exists whereas the white areas represent the regions where the 0:1 phase-locked solution representing no firing of the neuron exists. There is a short dashed line just above the solid line in panel b, though too short to be clearly visible, which indicates a period-doubling bifurcation curve. Note that there is no bifurcation curve above the end of this dashed line, indicating that the 1:1 phase-locked solution continuously changes into the 0:1 phase-locked solution here.

