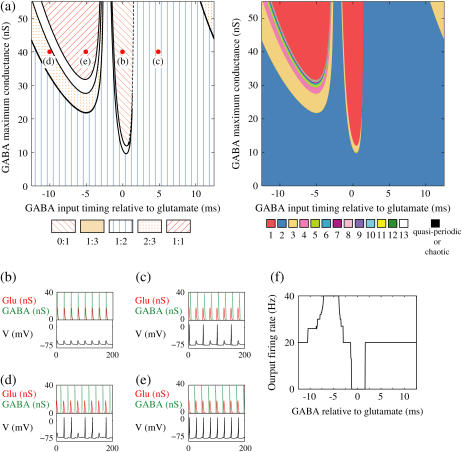
FIGURE 4.
Neuronal responses to periodic glutamatergic and GABAergic inputs of γ-frequency: simulation and bifurcation analysis. (a) The left panel shows the numerically calculated bifurcation sets with respect to Δt and  under the fixed parameters T = 25 (ms),
  (ms), and
  Solid and dashed lines indicate numerically calculated saddle-node and period-doubling bifurcation curves, respectively. The right panel is a corresponding result by explicit simulation of Eqs. 1 and 2 using the Runge-Kutta method; different colors indicate solutions with different periods. The colors listed right below indicate the periods of the solution: the numbers under the colors indicate how many input cycles are included in the period of the solution. These colors are commonly used throughout this article. (b–e) Glutamatergic and GABAergic synaptic conductances indicated by red solid and green dotted lines, respectively (top panels), and resulting wave forms of the membrane potential (bottom panels) at the locations in the 0:1 (b), 1:2 (c), 2:3 (d), and 1:1 (e) phase-locked regions, as indicated by red circles in panel a. (f) The relationship between the time difference Δt (ms) and the neuronal firing rate for a fixed value of the maximum conductance of the GABAergic inputs
  (nS). The firing rate was calculated by numerically solving Eqs. 1 and 2 for 1000 ms.

